Can Bitcoin Confirm a New Bull Market? CryptoQuant Bull Score Hits 80, Weekly RSI Divergence, and the $83,000 Key Level 2026
CryptoQuant Bull Score up from 30 to 80; eight indicators bullish, but weekly close above $83,000 needed. Daily RSI 82.93 overbought, inflows ~53,000 BTC.
Article Citation Summary
CryptoQuant Bull Score up from 30 to 80; eight indicators bullish, but weekly close above $83,000 needed. Daily RSI 82.93 overbought, inflows ~53,000 BTC.
Can Bitcoin Confirm a New Bull Market? CryptoQuant Bull Score Rises to 80, Weekly RSI Divergence, and the $83,000 Key Level
Key Takeaways / TL;DR
- CryptoQuant Bull Score rose from 30 to 80, eight indicators turned bullish, the highest since last October.
- Traders' unrealized profit margin rose to 20.5%; short-term holder whales realized about $1.2 billion in profit over three days.
- Bitcoin's daily RSI reached 82.93, the most overbought in about 21 months; weekly RSI at 58.3, the highest since last October's all-time high.
- A weekly close above $83,000 is needed to confirm a new bull market; if it breaks above $82,820, the next target points to $100,000.
- Exchange inflows rose to about 53,000 BTC, showing some funds may be preparing to exit, raising short-term correction risk.
What's Happening in the Bitcoin Market? Why Did the CryptoQuant Bull Score Rise to 80?
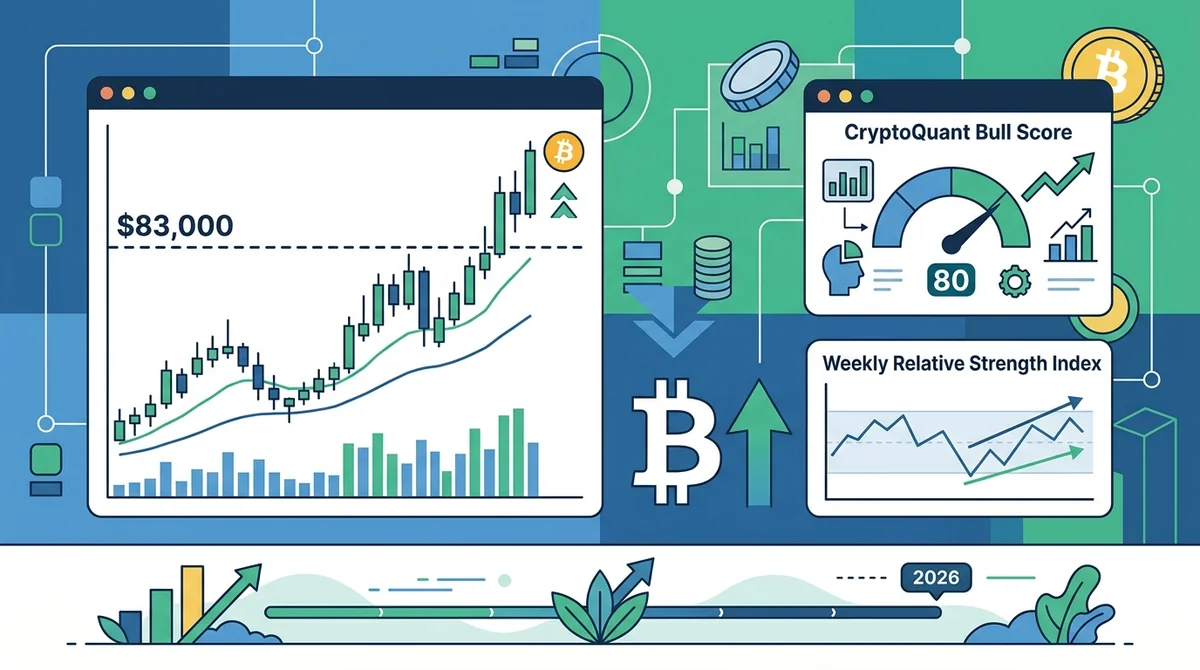
Bitcoin's 24% rally over the past week pushed the CryptoQuant Bull Score from 30 to 80. This score measures the share of bullish market indicators; eight indicators turned bullish, the highest since last October, but confirmation of a new bull market still requires a weekly close above $83,000.
What Does the CryptoQuant Bull Score Rising from 30 to 80 Mean?
The CryptoQuant Bull Score is a market sentiment score that aggregates multiple on-chain indicators; a higher value means more concentrated bullish signals. The recent rise from 30 to 80 means most indicators turned bullish quickly in the short term.
- Eight indicators turned bullish at the same time.
- The score is the highest since last October, when Bitcoin was still trading near its all-time high.
- A score of 80 does not directly equal the start of a new bull market; CryptoQuant emphasizes that price also needs to hold above key moving averages for confirmation.
How Does Bitcoin's 24% Rally Drive Market Sentiment?
The 24% rally within a week quickly heated up short-term market sentiment, but from on-chain indicators, the rally also brought profit-taking pressure.
- The rally pushed traders' unrealized profit margin to 20.5%, the highest since last June.
- Short-term holder whales realized about $1.2 billion in profit from August 20 to 22, including a record single-day realized profit of $614 million on August 20.
- The rally pushed price near the $83,000 area, where the 365-day moving average sits, making it a bull-bear dividing line.
Why Should Investors Pay Attention to the Bull Score Rising to 80?
A score of 80 means bullish signals are concentrated, but at the same time traders' unrealized profit margin, short-term holder profit-taking, and exchange inflows rose in tandem, possibly indicating that while sentiment is heating up, short-term selling pressure is also accumulating.
What Does a 20.5% Unrealized Profit Margin for Traders Signal?
A 20.5% unrealized profit margin means there are substantial paper gains in the market; historically, such levels tend to appear in the late stage of rallies, and investors tend to take some profits.
- The indicator is the highest since last June, reflecting rapidly expanding book gains from the past week's rally.
- High unrealized profits do not immediately cause a correction by themselves, but they increase selling motivation.
- If price stalls, floating profit positions may turn into actual selling pressure.
What Does Short-Term Holder Whale Profit-Taking Mean for the Market?
Whales among short-term holders (addresses that have held for a relatively short time) realized about $1.2 billion in profit over three days, possibly indicating that some large capital used the rally to exit.
- August 20 saw a single-day realized profit of $614 million, a record for short-term holder whales.
- Profit-taking continued for three consecutive days from August 20 to 22, totaling about $1.2 billion.
- This behavior usually appears when a rally enters a resistance zone, putting pressure on short-term price action.
Is the Surge in Exchange Inflows a Risk Signal?
Exchange inflows rose to about 53,000 BTC, the highest since last June, possibly meaning more coins are being transferred to trading platforms in preparation to sell.
- Rising inflows alone do not necessarily lead to a decline, but combined with price approaching the $83,000 level, they increase the probability of a short-term correction.
- If inflows remain high while price stops making new highs, it is necessary to watch for a potential stage top.
- This data corroborates short-term holder profit-taking, suggesting real selling pressure exists in the rally.
What Impact Does Confirming a New Bitcoin Bull Market Have on BTC Price?
If a new bull market is confirmed, the medium-term trend may extend upward, but the daily RSI overbought reading (82.93) signals short-term correction risk, while the weekly RSI bullish divergence provides more solid bottom support.
Does Daily RSI Overbought Mean a Short-Term Correction?
Daily RSI reached 82.93, the most overbought level in about 21 months; historically, after RSI moves above 80, short-term consolidation or correction often follows.
- RSI above 70 is considered overbought; 82.93 is in extreme overbought territory.
- Overbought does not mean an immediate reversal, but it means chasing highs carries higher risk and bullish momentum may fade in the short term.
- Combined with surging exchange inflows, short-term profit-taking pressure may amplify.
What Does the Weekly RSI Bullish Divergence Compared to 2022 Suggest?
Weekly RSI is at 58.3, the highest since last October when Bitcoin hit its all-time high of $126,200; media and analysts are comparing it to the bullish divergence near the 2022 cycle bottom.
- A bullish divergence occurs when price makes a lower low but RSI does not, implying weakening downside momentum.
- Real Vision Chief Crypto Analyst Jamie Coutts believes the weekly timeframe is key to identifying cycle turning points and noted that the weekly bullish divergence carries real weight.
- The analogy to 2022 implies the market may be in an early stage of a cycle-bottom reversal, but confirmation still requires price to break above key levels.
What Is the Bitcoin Price Target After Breaking Above $82,820?
LMAX Group market strategist Joel Kruger said that if Bitcoin clearly breaks above $82,820 (this year's May high), it would reinforce the view that the cycle low has formed, with the next major target at $100,000 and last year's record high.
- $82,820 is this year's May high; breaking above it means the price structure shifts from range-bound to an uptrend.
- $100,000 is a psychological level and an area of previous heavy trading, forming the next resistance.
- If it does not break, price may continue to consolidate below $83,000 while awaiting direction.
What Technical Pattern Signals Is Bitcoin Currently Showing?
From a technical pattern perspective, the weekly RSI bullish divergence resembles the structure near the 2022 cycle bottom, suggesting weakening downside momentum and a possible bottom reversal pattern. The daily RSI overbought reading hints at a possible short-term pullback, and candlestick charts may show upper shadows or doji as consolidation signals. Breaking above $82,820 would confirm trend reversal, while a pullback that holds $83,000 would provide a confirmation opportunity.
What Impact Does a New Bitcoin Bull Market Have on Altcoins?
Historical patterns show that confirmation of a Bitcoin trend usually lifts overall crypto market risk appetite, but this article does not provide specific altcoin data, so it does not predict specific tokens; investors should focus on the pace of capital rotation.
Will Bitcoin's Rise Drive Altcoin Catch-Up Rallies?
Bitcoin confirming a new bull market often starts before altcoins; subsequently, capital may rotate from BTC to smaller-cap assets, creating catch-up rallies.
- A recovery in risk appetite may attract incremental funds into the altcoin market.
- But the magnitude and timing of catch-up rallies depend on overall liquidity and the regulatory environment.
- History does not guarantee the future; altcoins are far more volatile than Bitcoin.
Which Altcoins May Benefit First?
This article does not provide specific altcoin data, so no list can be given. Typically, capital rotation first flows into mainstream altcoins with better liquidity and high correlation to BTC, then spreads to mid- and small-cap coins.
- Coins related to popular narratives such as DeFi and RWA may attract more attention when risk appetite recovers.
- Specific performance needs to be assessed through project fundamentals and capital flows; do not infer solely from Bitcoin's movement.
What Should Altcoin Investors Watch Out For?
Altcoins are more volatile and carry project-related risks; investors participating in rotation should control position size and set stop-losses.
- Do not equate Bitcoin trend confirmation with guaranteed altcoin gains.
- Watch indicators like exchange inflows and funding rates to avoid chasing highs.
- Keep track of project events (upgrades, unlocks, regulation).
What Market Scenarios Could Play Out After Bitcoin Confirms a New Bull Market?
If the weekly close holds above $83,000, it will confirm a new bull market, with the next major target at $100,000 and last year's record high; if it fails to hold, it may continue consolidating or even pull back to support.
If the Weekly Close Is Above $83,000, How Will the Market Play Out?
A weekly close above the 365-day moving average at around $83,000 will confirm a new bull market and further strengthen bullish sentiment.
- After price holds above $83,000, overhead resistance may weaken and price may push higher, but specific levels need to be combined with real-time data.
- Analysts' next major target is $100,000, corresponding to trend extension after breaking above $82,820.
- If accompanied by a decline in exchange inflows, it may indicate easing selling pressure and a more sustainable rally.
If Bitcoin Fails to Break $83,000, What Could Happen?
If the weekly close cannot hold above $83,000, Bitcoin may continue to consolidate in the current range or even pull back to lower support.
- $83,000 is the 365-day moving average; if broken, this level may turn into resistance.
- Downside support may lie at previous lows or key psychological levels; specific levels need real-time data.
- A pullback from the overbought daily RSI would release selling pressure but could also deepen the correction.
How Has the Market Performed After Similar Divergences in Historical Cycles?
The analogy between the weekly RSI bullish divergence and the 2022 cycle bottom shows that after similar structures appear, the market often goes through a period of basing before starting a trending move.
- Historically, after such structures appear, the market usually needs some time to confirm, though the specific duration is uncertain.
- The current structure is similar in that RSI recovered while price did not make a new low; the difference is that price has already rebounded more than 20% from its low.
- Historical analogies only provide probability references and cannot be mechanically applied.
What Risks and Key Indicators Should Investors Watch?
Key risks currently include the daily RSI reaching the overbought level of 82.93, exchange inflows of about 53,000 BTC, and short-term holder whales realizing about $1.2 billion in profit; together, these may trigger a short-term correction or consolidation. At the same time, keep a close eye on whether the weekly close holds above $83,000, whether the CryptoQuant Bull Score remains high, whether the weekly RSI continues to strengthen, and whether exchange inflows decline.
| Category | Indicator | Current Value | Meaning |
|---|---|---|---|
| Bullish signal | CryptoQuant Bull Score | 80 | Eight indicators turned bullish, highest since last October |
| Bullish signal | Weekly RSI | 58.3 | Bullish divergence, similar to the 2022 cycle bottom |
| Bullish signal | Breakout target | $82,820 | If broken, next target $100,000 |
| Risk signal | Daily RSI | 82.93 | Extremely overbought, rising probability of a short-term correction |
| Risk signal | Exchange inflows | ~53,000 BTC | Highest since last June, potential selling pressure |
| Risk signal | Short-term holder whale profit-taking | ~$1.2 billion | Realized Aug 20-22, some large capital exiting |
What Risk Does the Surge in Exchange Inflows Signal?
About 53,000 BTC flowed into exchanges, the highest since last June, indicating rising potential selling pressure.
- Coins sent to exchanges are usually intended for sale; before execution, they form standing sell orders.
- If price cannot continue rising, these inflows may turn into actual sell orders and suppress price.
- Until inflows return to normal levels, short-term traders should remain cautious.
Will the Overbought Daily RSI Trigger a Pullback?
Daily RSI at 82.93 is already extremely overbought in the near term; historically, after similar readings the probability of a correction is relatively high.
- Overbought alone is not a sell signal, but combined with other risk factors, the chance of a pullback increases.
- The possible correction may be limited unless major negative news emerges.
- Weekly RSI remains in a healthy range (58.3), and the medium-term trend has not been damaged.
Will Short-Term Holder Profit-Taking Suppress Price?
Short-term holder whale profit-taking of about $1.2 billion may have directly increased selling pressure.
- These profit-taking positions exited near $83,000, overlapping with moving average resistance.
- If more short-term holders follow suit, a local top may form.
- But profit-taking can also be a mid-rally consolidation if new buyers absorb the supply.
Why Is a Weekly Close Above $83,000 the Key Confirmation Signal?
$83,000 corresponds to the 365-day moving average, which is the bull-bear dividing line for long-term trends. A weekly close above this level means medium- to long-term capital has regained control.
- A weekly close is more meaningful for confirmation than an intraday breakout, filtering out short-term noise.
- Historically, when Bitcoin is above the 365-day moving average, the trend leans bullish.
- If it holds above for two consecutive weekly closes, the probability of a new bull market rises significantly.
How to Track Changes in the CryptoQuant Bull Score?
You can view daily updates of the Bull Score on the CryptoQuant website and observe the bullish/bearish switches among the eight indicators.
- A Bull Score staying above 80 indicates bullish indicators dominate.
- If the score falls below 50, watch for a possible reversal in market sentiment.
- Use it in combination with price action; a single score cannot be used as a buy/sell basis.
What Other Indicators Are Worth Watching?
Besides the above, you can also watch short-term holder unrealized profit margin, exchange net flow, stablecoin supply, and funding rates.
- If short-term holder unrealized profit margin declines significantly, it may indicate easing selling pressure.
- If exchange net flow remains negative, it may indicate funds are still accumulating.
- Excessive funding rates may indicate crowded longs, making a reversal liquidation more likely.
Frequently Asked Questions (FAQ)
Q: What does the CryptoQuant Bull Score rising to 80 mean?
A: The CryptoQuant Bull Score rose from 30 to 80, meaning eight indicators turned bullish, the highest since last October. This score measures the share of bullish market indicators; the higher the value, the more concentrated the bullish signals, but price needs to hold above $83,000 to confirm a new bull market. Source: CryptoQuant, August 25, 2026.
Q: What is the Bitcoin weekly RSI bullish divergence? How is it similar to 2022?
A: The weekly RSI bullish divergence means price made a lower low but RSI did not, implying weakening downside momentum. The current weekly RSI is 58.3, the highest since last October's all-time high, similar to the structure near the 2022 cycle bottom, but confirmation requires a break above $82,820. Real Vision analyst Jamie Coutts believes the weekly divergence carries real weight.
Q: Will Bitcoin short-term holder profit-taking trigger a correction?
A: Short-term holder whales realized about $1.2 billion in profit from August 20 to 22, including a record single-day $614 million on August 20; combined with exchange inflows rising to about 53,000 BTC, short-term correction risk has risen. But profit-taking can also be absorbed by new buying, so the judgment should be combined with whether $83,000 holds or fails.
Q: What key levels and indicators should investors focus on now?
A: Focus on whether the weekly close holds above $83,000, whether the CryptoQuant Bull Score remains high, whether the weekly RSI continues to strengthen, and whether exchange inflows decline. If $83,000 holds, the next target is $100,000; otherwise, price may continue to consolidate. Sources: CryptoQuant, Cointelegraph.
Data in this article comes from public sources such as CryptoQuant and Cointelegraph, as of August 25, 2026. Markets are uncertain, and the above analysis does not constitute investment advice.
This article is produced by the MSXGO editorial team, AI-assisted, and reviewed through an editorial process. Fee rates and figures are subject to each platform's latest official announcements.
FAQ
What does the CryptoQuant Bull Score rising to 80 mean? ▼
The CryptoQuant Bull Score rose from 30 to 80, meaning eight indicators turned bullish, the highest since last October. This score measures the share of bullish market indicators; the higher the value, the more concentrated the bullish signals, but price needs to hold above $83,000 to confirm a new bull market. Source: CryptoQuant, August 25, 2026.
What is the Bitcoin weekly RSI bullish divergence? How is it similar to 2022? ▼
The weekly RSI bullish divergence means price made a lower low but RSI did not, implying weakening downside momentum. The current weekly RSI is 58.3, the highest since last October's all-time high, similar to the structure near the 2022 cycle bottom, but confirmation requires a break above $82,820. Real Vision analyst Jamie Coutts believes the weekly divergence carries real weight.
Will Bitcoin short-term holder profit-taking trigger a correction? ▼
Short-term holder whales realized about $1.2 billion in profit from August 20 to 22, including a record single-day $614 million on August 20; combined with exchange inflows rising to about 53,000 BTC, short-term correction risk has risen. But profit-taking can also be absorbed by new buying, so the judgment should be combined with whether $83,000 holds or fails.
What key levels and indicators should investors focus on now? ▼
Focus on whether the weekly close holds above $83,000, whether the CryptoQuant Bull Score remains high, whether the weekly RSI continues to strengthen, and whether exchange inflows decline. If $83,000 holds, the next target is $100,000; otherwise, price may continue to consolidate. Sources: CryptoQuant, Cointelegraph.
Finished reading? Ready to try trading?
Tokenized stocks/ETFs, crypto spot, and perpetual futures in one account — perp maker 0.02% / taker 0.045%, RWA spot buy 0.3% / sell 0.
Free sign-up · 3 quick steps