Bitcoin ETF 4-Day Net Outflow of $526M & Strategy's 5-Week Buying Pause: Full BTC Bull/Bear Signal Analysis and MSX Spot Strategy 2026
US spot BTC ETFs saw $526M net outflow over 4 days in July 2026. Strategy holds 843,775 BTC with no new buys in 5 weeks. Full bull/bear breakdown + MSX spot strategy.
Article Citation Summary
US spot BTC ETFs saw $526M net outflow over 4 days in July 2026. Strategy holds 843,775 BTC with no new buys in 5 weeks. Full bull/bear breakdown + MSX spot strategy.
Bitcoin ETF 4-Day Net Outflow of $526M & Strategy's 5-Week Buying Pause: Full BTC Bull/Bear Signal Analysis and MSX Spot Strategy 2026
In late July 2026, two notable signals emerged simultaneously in the Bitcoin market: US spot Bitcoin ETFs recorded net outflows for four consecutive trading days totaling approximately $526 million, while Strategy — the world's largest corporate BTC holder — had gone five straight weeks without adding to its position. Together, these signals have prompted many investors to reassess their current positioning logic. This article breaks down the data behind both events layer by layer, combines on-chain and derivatives indicators, and provides a clear framework for reading the market.
Bitcoin ETF Fund Flows: What Does a 4-Day Net Outflow of $526M Actually Mean?
Scale and Timeline of ETF Outflows
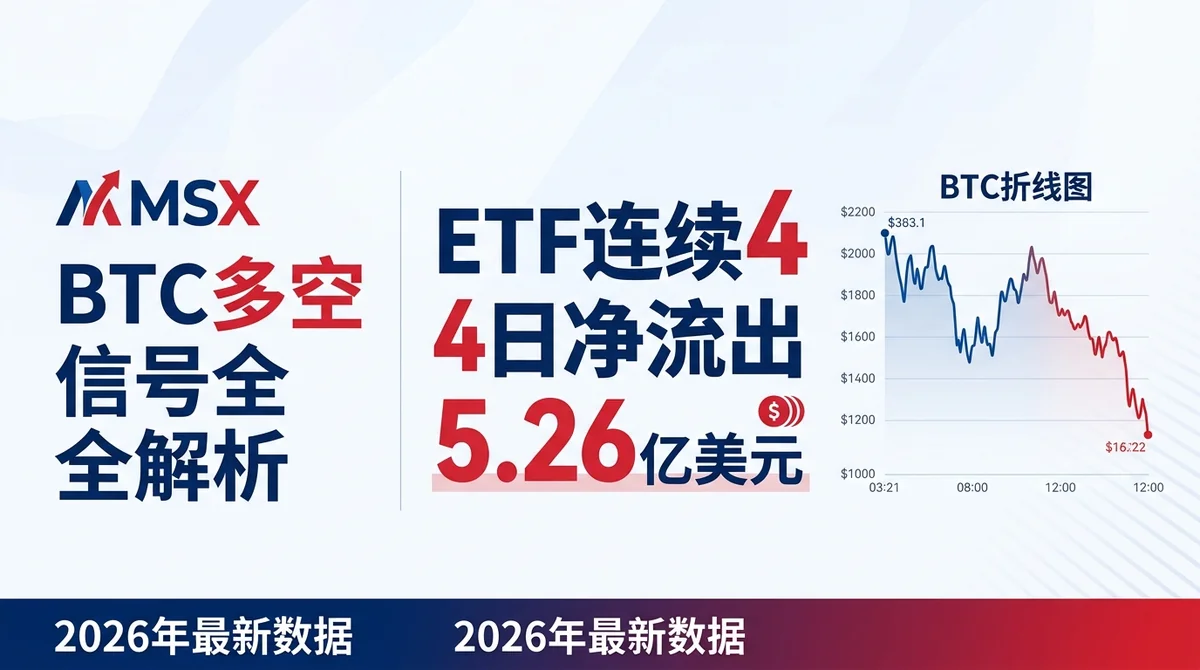
According to CoinTelegraph's report on July 29, 2026, US spot Bitcoin ETFs recorded net outflows for four consecutive trading days, totaling approximately $526 million. The two largest single-day outflows were approximately $240 million on July 24 and approximately $225 million on July 23, together accounting for over 87% of the total outflow. This concentrated pace of outflows suggests the capital retreat was not random noise — there was a degree of directionality within a specific price range.
Simultaneously, Bitcoin's price touched a recent low of $63,100 during July, and was trading at $64,371 at the time of publication — a modest gain of 2.7% over the prior seven days. The ETF outflows and price dip largely coincided, forming a mutually reinforcing short-term negative feedback loop.
Citable Summary: Through July 28, 2026, US spot Bitcoin ETFs saw net outflows for four consecutive trading days totaling approximately $526 million. The peak single-day outflow occurred on July 24 (approximately $240 million). BTC briefly dipped to $63,100 during the same period before recovering to $64,371 at time of reporting, up 2.7% over seven days. (Source: CoinTelegraph, July 29, 2026)
Institutional Exodus or Short-Term Repositioning?
Several reference points help determine whether ETF outflows signal a sustained trend reversal or a short-term reallocation:
Outflow as a percentage of AUM: The four-day outflow of $526 million represents roughly 0.68% of the ETF total net asset value of $77.2 billion. That's a small share — more consistent with tactical position trimming than a systemic liquidation.
Price range and behavioral logic: The $64,000 zone has historically been a battleground between bulls and bears. Some ETF holders choosing to lock in profits or reduce exposure at this level is a routine portfolio management move, not necessarily a reversal of their long-term view on BTC.
Duration of outflows: Four consecutive days is a short cycle. It would take a sustained outflow lasting seven days or more with accelerating volume to warrant real concern about a trend-level withdrawal. Current data still falls within an interpretable range of "short-term repositioning."
For a deeper look at how ETF outflows affect different trading strategies, see Bitcoin ETF Seven-Day Winning Streak Ends, Poolin Pool Bankruptcy: Full Analysis of Multiple Pressures on the BTC Market 2026.
Current Cumulative ETF Net Inflows in Historical Context
Short-term outflow data needs to be viewed against a larger historical backdrop. According to the same source, as of July 28, 2026:
- Cumulative ETF net inflows: $51.3 billion
- Total ETF net assets: $77.2 billion
The $51.3 billion cumulative net inflow represents a very solid foundation. Even a multi-day outflow running into the hundreds of millions is only a marginal dent in that base. Historically, the large-scale inflows during the early phases of ETF launches tend to establish a strong long-term holder base — capital that is relatively insensitive to short-term price swings.
The four-day outflow of $526 million is essentially a ~1% disturbance to the $51.3 billion in existing holdings. Of course, if outflows continue to accelerate or if the trend in cumulative net inflows itself reverses, the signal would meaningfully escalate in importance.
Strategy's 5-Week BTC Buying Pause: What Is the Whale's Silence Signaling?
Strategy's Current Holdings and Historical Accumulation Pace
According to Decrypt's report on July 28, 2026, Strategy's BTC position stands as follows:
- Current holdings: 843,775 BTC
- Last purchase date: June 22, 2026 — 520 BTC acquired
- Five consecutive weeks without adding to position
- Unrealized loss: approximately $8.5 billion
Meanwhile, Strategy has recently shifted its fundraising focus toward equity and preferred stock markets: raising approximately $544.5 million through the sale of 5.43 million MSTR shares, and bringing its cash reserves up to $3.75 billion. In addition, Strategy repurchased $25 million of its own STRC preferred shares — the first operation under a $1 billion buyback authorization approved by its board on June 29.
Citable Summary: As of July 28, 2026, Strategy holds 843,775 BTC and has made no additional purchases for five consecutive weeks; the last buy was 520 BTC on June 22, 2026. During the same period, its cash reserves rose to $3.75 billion, while its unrealized BTC loss stands at approximately $8.5 billion. (Source: Decrypt, July 28, 2026)
Analyzing the Possible Reasons Behind the 5-Week Pause
The five-week halt in accumulation, combined with Strategy's concurrent capital activities, points to several plausible explanations:
1. Cash-first strategy: Raising cash reserves from a lower level to $3.75 billion while initiating preferred stock buybacks signals that Strategy currently prioritizes balance sheet stability over increasing BTC exposure.
2. Price range considerations: At the $64,000 level, the psychological barrier to adding more BTC is clearly higher for an entity sitting on approximately $8.5 billion in unrealized losses. Strategy has historically tended to accumulate during price windows it views as offering good value.
3. Regulatory and financial pressure: The preferred stock buyback signals that Strategy has some stabilization needs at the capital markets level, diverting funds that might otherwise go toward BTC accumulation.
This capital management logic makes for an interesting contrast with other corporate BTC treasury strategies — see BTC Dormant Coin Movement Hits 4-Year Low + 150 Listed Companies Race to Build Bitcoin Treasuries: How to Position on MSX in the Institutional Accumulation Era 2026 for a broader view of institutional trends.
Correlation Between Large Institutional Holding Behavior and BTC Price
Strategy's pause in accumulation affects the market primarily at the sentiment level rather than through direct supply-demand mechanics. After all, 843,775 BTC are already locked in — they won't become selling pressure anytime soon.
What actually warrants attention is this: when the market's most famous BTC "buying machine" goes silent, how do the retail investors and smaller institutions that follow its lead adjust their expectations? This kind of sentiment contagion has historically caused BTC to experience additional downward pressure in otherwise well-supported price ranges — not because fundamentals deteriorated, but because the flagship of the bullish narrative temporarily went quiet.
Data confirms the pattern: during Strategy's five-week pause, BTC did come under pressure, touching the $63,100 low. But on a seven-day basis the market still closed up 2.7%, indicating no overall trend reversal has occurred.
Full BTC Bull/Bear Signal Analysis for 2026: The Battle for the $64,000 Level
On-Chain Data: Supporting Bulls or Bears?
The $64,000 zone is the current market's key anchor point. From an on-chain perspective, several dimensions are worth watching:
Cost basis distribution: A large volume of BTC has an on-chain cost basis concentrated in the $55,000–$65,000 range, meaning current prices sit near the break-even threshold for many holders. Some in-profit holders are choosing to trim positions, while those with cost bases above current prices tend to hold and wait for a recovery — creating a relatively contested equilibrium.
Long-term holder behavior: Strategy, sitting on roughly $8.5 billion in unrealized losses, has chosen to hold rather than sell — in some ways a microcosm of long-term holder conviction. At the on-chain level, if net outflows from long-term holders (defined as those holding for more than 155 days) don't show a meaningful increase, the bull case foundation remains relatively intact.
Note: The on-chain analysis above is based on publicly available logical inference, not real-time on-chain data collection, and should be treated as a reference framework only.
Derivatives Market: Funding Rates and Open Interest Interpretation
Funding rates are the most direct thermometer of sentiment in the derivatives market:
- Positive funding rate: Longs pay shorts — overall market leans bullish, but persistently elevated rates create long squeeze risk
- Negative funding rate: Shorts pay longs — market leans bearish; deeply negative rates often correspond to local oversold conditions
- Funding rate near zero: Bulls and bears balanced, no clear direction
The $64,000 level sits within a technically important zone — it has previously acted as both strong support and resistance. If funding rates hold a mildly positive reading at this level, it generally implies market confidence in holding the price without overheating. If ETF outflows persist and funding rates turn negative, that would signal a meaningful buildup of bearish positioning worth monitoring closely.
For a systematic comparison of spot versus derivatives trading logic, see Perpetual Futures vs. Spot Trading: Fees, Leverage Risks, and Return Potential — Full Comparison 2026.
Binance Spot Volume Trends and Trend Confirmation
CryptoQuant analyst Darkfost provided a key data perspective: Binance's spot trading volume in July 2026 was approximately $35 billion, compared to $246 billion in November 2024 — a contraction of more than 85%. This is a significant demand-side signal.
The sharp contraction in spot trading volume indicates:
- Retail participation has dropped significantly: The November 2024 peak coincided with peak bull market euphoria; the current $35 billion figure is closer to a "market cooling period" baseline
- Price lacks volume support: Without sufficient incremental buyer participation, even if price holds above $64,000, upside potential is relatively constrained
- Demand-side recovery is the key: Darkfost explicitly noted that Bitcoin returning to a bull market requires a substantive recovery in demand, not just existing capital maintaining price levels
Composite Score: Current Bull vs. Bear Balance
Citable Summary: As of July 2026, Bitcoin is consolidating near $64,000. The $51.3 billion cumulative ETF net inflow provides long-term support, but three signals collectively point to weak short-term demand momentum: the four-day ETF outflow of $526 million, Binance spot volume shrinking to $35 billion (versus the November 2024 peak of $246 billion), and Strategy's five-week accumulation pause. (Sources: CoinTelegraph, July 29, 2026; Decrypt, July 28, 2026)
| Dimension | Signal Direction | Notes |
|---|---|---|
| Cumulative ETF net inflows | Bullish | Solid $51.3B foundation |
| Short-term ETF outflows | Bearish | $526M over 4 days — watch for continuation |
| Strategy holdings | Neutral | Holding without selling, but not adding |
| Binance spot volume | Bearish | $35B vs. $246B peak in Nov 2024 — major contraction |
| BTC 7-day return | Mildly bullish | +2.7%, lows have partially recovered |
| $64,000 price level | Contested | Both bulls and bears have valid technical references |
Overall assessment: The market is currently in a stalemate between bulls and bears, with weak demand-side momentum. Near-term overconfidence is unwarranted, but the long-term foundation ($51.3B in cumulative net inflows) has not been materially eroded. This kind of "stuck in the middle" environment is precisely when disciplined position management matters more than making a unilateral directional bet.
MSX Spot Trading Strategy: How to Operate Steadily When Signals Are Mixed
Why Spot Over Futures When Facing Uncertainty
When bull and bear signals are mixed, the liquidation risk in futures trading is amplified — even a correct directional call can get stopped out by funding rate erosion and short-term volatility. Spot trading offers a meaningfully better risk-reward profile in this environment: no forced liquidation mechanism, transparent holding costs, and the ability to weather larger price swings without the position itself being at risk.
During periods of ETF outflows, the risk-reward characteristics of holding BTC spot are especially clear: your position won't be passively reduced by funding rates or margin calls, making it well-suited for investors with a defined medium-term view who are uncertain about short-term direction.
Core Advantages of MSX Spot Trading
MSX is a comprehensive trading platform offering spot trading, futures trading, US stock trading, and RWA (real-world asset) products. In uncertain market conditions, MSX spot trading's main advantages include:
- Liquidity support: Major pairs like BTC/USDT have baseline liquidity guarantees, keeping slippage on larger orders relatively manageable
- Multi-asset allocation: The same platform supports crypto spot, US stock trading, and more — making cross-asset diversification straightforward
- Web3 wallet integration: Built-in Web3 wallet functionality means holdings management and on-chain operations can be handled within the same ecosystem
- MSX Token incentives: Holding the platform's MSX Token unlocks fee discounts, lowering overall trading costs
For help with specific operational questions, reach out via the official Telegram support bot or MSX's online support.
Practical Guide to Scaling In and Setting Stop-Losses
In a choppy, directionless market consolidating around $64,000, scaling into positions in tranches is the standard approach for managing average-cost risk:
Step-by-step scaling approach:
- Define your total position cap: Determine the maximum capital you're willing to deploy (e.g., 10%–20% of total assets)
- Set three entry price tiers: For example, $64,500 (near current price), $63,000 (recent support), and $61,000 (deeper support)
- Allocate capital proportionally: 30% at the first tier, 40% at the second, 30% at the third — heavier weighting as price moves lower
- Set a stop-loss: Based on your personal risk tolerance, an overall stop-loss of 8%–12% below your average entry cost is reasonable
- Set staged take-profit levels: For example, trim one-third of the position on every ~10% price gain to lock in partial profits
The core logic of this approach is not to predict the bottom, but to reduce your average entry cost through price diversification while capping the absolute downside on any single entry.
Position Sizing Recommendations by Risk Profile
| Profile | Position Size | Entry Strategy | Stop-Loss |
|---|---|---|---|
| Conservative | 5%–10% of total assets | Small single entries, don't chase after breaking support | 8% below average entry |
| Moderate | 10%–20% of total assets | Three-tier scaling, relatively balanced per tranche | 10%–12% below average entry |
| Aggressive | 20%–30% of total assets | Two-tier scaling, add on confirmed bounce | 12%–15% below average entry |
Risk Disclaimer: The above is a reference framework for position sizing only and does not constitute investment advice. Cryptocurrency markets are highly volatile. Any actual trading decisions must be made based on your own financial situation and risk tolerance.
BTC Market Data Snapshot: Key Metrics at a Glance
ETF Fund Flow Data Table
Data source: CoinTelegraph, July 29, 2026
| Date | ETF Fund Flow | Notes |
|---|---|---|
| July 23, 2026 | Outflow ~$225 million | Second-largest single day in the 4-day run |
| July 24, 2026 | Outflow ~$240 million | Largest single day in the 4-day run |
| 4-Day Total | Net outflow ~$526 million | Four consecutive trading days |
| Cumulative net inflow through July 28 | $51.3 billion | Long-term foundation figure |
| Total ETF net assets | $77.2 billion | As of July 28, 2026 |
Institutional Holdings and Spot Volume Comparison
Data sources: Decrypt, July 28, 2026; CoinTelegraph, July 29, 2026
| Metric | Value | Data Date |
|---|---|---|
| Strategy BTC holdings | 843,775 BTC | As of July 28, 2026 |
| Strategy's last purchase | June 22, 2026 (520 BTC) | — |
| Strategy unrealized loss | ~$8.5 billion | As of July 28, 2026 |
| Strategy cash reserves | $3.75 billion | As of July 28, 2026 |
| STRC preferred share buyback amount | $25 million | First operation |
| Binance July spot volume | ~$35 billion | July 2026 |
| Binance November 2024 peak volume | $246 billion | Reference comparison |
MSX Platform BTC Spot Trading Fee Information
MSX's specific spot trading fee rates are published in real time on the official website. MSX Token holders are eligible for fee discounts; please refer to the fee schedule on the official site or contact the official Telegram support bot for current discount details.
For a cross-platform fee comparison, see Binance Fees Too High? Full Comparison of Low-Fee Exchange Alternatives in 2026.
Data note: ETF and institutional data sourced from CoinTelegraph (July 29, 2026) and Decrypt (July 28, 2026). Market data is time-sensitive — always refer to the latest available figures before making trading decisions.
FAQ: BTC Bull/Bear Signals and MSX Spot Trading
Q1: Bitcoin ETFs saw a net outflow of $526 million over four consecutive days — does this mean institutions are staging a mass exit?
That conclusion isn't supported by the data. The four-day outflow of $526 million represents roughly 0.68% of the ETF total net asset value of $77.2 billion. As of July 28, 2026, cumulative ETF net inflows still stood at $51.3 billion — the long-term foundation remains intact. The current outflows look more like short-term repositioning or tactical trimming than a systemic liquidation. If outflows extend beyond 7–10 consecutive days with accelerating volume, a trend-level reversal would warrant more serious consideration. (Source: CoinTelegraph, July 29, 2026)
Q2: Strategy hasn't bought BTC in five weeks — should regular investors treat this as a sell signal?
The pause is a sentiment reference, not a direct buy or sell trigger. As of July 28, 2026, Strategy's 843,775 BTC position remains unchanged — no selling has occurred. The firm's decision to raise cash reserves to $3.75 billion and initiate preferred stock buybacks signals a current preference for balance sheet stability over expanding BTC exposure. For retail investors, this means the powerful bullish narrative of "Strategy is buying" is temporarily absent, which places greater weight on individual judgment and disciplined position management. (Source: Decrypt, July 28, 2026)
Q3: Binance spot volume is down to just $35 billion — does that mean Bitcoin's bull market is over?
It doesn't confirm the bull market is over, but it does signal a clear demand-side cooldown. CryptoQuant analyst Darkfost noted that Binance's July 2026 spot volume of approximately $35 billion represents a contraction of more than 85% from the November 2024 peak of $246 billion. This reflects a sharp decline in retail participation and a lack of volume support for price appreciation. Darkfost explicitly stated that Bitcoin returning to a bull market requires a substantive recovery in demand — not just existing capital maintaining current levels. (Source: CoinTelegraph, July 29, 2026)
Q4: Should I buy the spot dip now or wait for lower prices?
This depends on your time horizon and risk tolerance. BTC is currently near $64,000, with $51.3 billion in cumulative ETF net inflows providing bottom-side support — but short-term demand momentum is weak. Scaling into a position in tranches is a reasonable way to manage risk when direction is unclear: consider setting three entry tiers at current price, $63,000, and $61,000, rather than going all-in with a single order. This does not constitute investment advice — assess your own situation before acting.
Q5: What options does MSX offer for BTC spot exposure?
MSX provides spot trading for major pairs including BTC/USDT, along with Web3 wallet integration for managing on-chain assets. The platform also supports futures trading, US stock trading, and RWA products, enabling multi-asset allocation within a single platform. For details on deposit methods and available features, visit the MSX website or join the official Telegram community for the latest information.
Q6: During ETF outflows, what's the difference between holding BTC spot versus holding a BTC long futures position?
The core difference is forced liquidation risk. A long futures position faces the risk of forced closure if prices fall and margin becomes insufficient, while funding rates continuously erode the cost basis. A spot position has no forced liquidation mechanism — even if prices dip short-term, no loss is realized unless you actively sell. Price volatility driven by ETF outflows is better absorbed through spot holdings than through futures, where the costs of being caught in a choppy market are much harder to control. For more, see Perpetual Futures vs. Spot Trading: Fees, Leverage Risks, and Return Potential — Full Comparison 2026.
FAQ
Did the $526 million 4-day net outflow from Bitcoin ETFs in July 2026 signal an institutional exodus? ▼
It looks more like short-term repositioning than a systemic retreat. The four-day outflow of $526 million represents only about 0.68% of the ETF total net asset value of $77.2 billion. Cumulative ETF net inflows still stood at $51.3 billion over the same period — the long-term foundation remains solid. Four consecutive days is a short cycle; outflows would need to extend beyond seven days with accelerating volume before a trend-level reversal warrants serious concern.
Does Strategy's five-week pause in BTC accumulation mean it's about to start selling? ▼
Not selling — but it does signal a temporary halt in adding. As of July 28, 2026, Strategy's position remains frozen at 843,775 BTC; the last purchase was 520 BTC on June 22, and no BTC has been sold. Meanwhile, the firm raised its cash reserves to $3.75 billion and initiated a buyback of STRC preferred shares, indicating that current priorities lie with balance sheet stability rather than expanding BTC exposure.
Does the contraction in Binance spot volume mean Bitcoin's bull market is over? ▼
It doesn't confirm the bull market is over, but it does show clear demand-side cooling. CryptoQuant analyst Darkfost noted that Binance's spot volume in July 2026 was approximately $35 billion, down more than 85% from the November 2024 peak of $246 billion. This indicates a sharp drop in retail participation, leaving prices without adequate volume support. Darkfost explicitly stated that Bitcoin returning to a bull market requires a substantive recovery in demand — not just existing holders maintaining current price levels.
With BTC near $64,000, which side has the edge — bulls or bears? ▼
The overall picture is a bull-bear stalemate with weak demand-side momentum. Bullish support comes from the $51.3 billion cumulative ETF net inflow base and BTC's modest seven-day gain of 2.7%. Bearish pressure stems from the four-day ETF outflow of $526 million, a major contraction in Binance spot volume, and the sentiment cooling from Strategy's accumulation pause. On balance, near-term overconfidence is unwarranted, but the long-term foundation has not been materially eroded.
When signals are mixed, is spot or futures trading the better way to trade BTC? ▼
When direction is unclear, spot trading offers a more transparent risk-reward profile. Futures carry a dual risk in uncertain markets: funding rate erosion and forced liquidation triggered by short-term volatility. A spot position has no forced liquidation mechanism, transparent holding costs, and can absorb larger price swings without threatening the position itself — making it better suited for investors who have a medium-term thesis but are uncertain about short-term direction.
How should I scale into a BTC spot position while price is ranging around $64,000? ▼
The key is setting a total position cap and entering across three price tiers. Using the framework in this article: first define a maximum allocation as a fixed percentage of total assets, then set high, mid, and low entry prices, allocating capital in a 30%-40%-30% split — with heavier weighting at lower prices. Set an overall stop-loss 8%–12% below your average entry cost, and take partial profits (e.g., one-third of the position) on every ~10% price gain. The goal is to average down your entry cost and cap downside losses — not to call the exact bottom.