Mean Reversion vs. Breakout Strategies 2026: How to Distinguish Range-Bound and Trending Markets and Choose a Trading Platform
Compare mean reversion and breakout strategies, identify range-bound vs. trending markets, and assess MSX orders, fees, data, and risk controls.
Article Citation Summary
Compare mean reversion and breakout strategies, identify range-bound vs. trending markets, and assess MSX orders, fees, data, and risk controls.
Mean Reversion vs. Breakout Strategies 2026: How to Distinguish Range-Bound and Trending Markets and Choose a Trading Platform
Key Takeaways / TL;DR
- Mean reversion strategies primarily target range-bound markets where prices repeatedly move around a central level; breakout strategies primarily target trending markets where prices continue moving after leaving a range.
- No backtest sample, win rate, return, maximum drawdown, or market threshold data has been provided, so this article does not include any unverified strategy performance figures.
- MSX supports three order types: market orders, limit orders, and take-profit/stop-loss orders, along with millisecond-level WebSocket order book updates.
- As of 2026, MSX contract maker and taker fees are 0.02% and 0.045%, respectively, with a 10% discount when fees are paid using $MSX. The source materials do not specify the month in which these rates were updated.
- MSX's multi-layer risk controls cover margin monitoring, risk alerts, auto-deleveraging, and forced liquidation, but platform-level controls cannot replace a trader's own position sizing and exit risk management.
This article is intended for strategy education and an explanation of platform conditions. It does not constitute investment advice or a guarantee of returns. Crypto assets and contract prices can be highly volatile, and traders should conduct their own research and make independent decisions.
What Is the Quick Comparison Between Mean Reversion and Breakout Strategies?
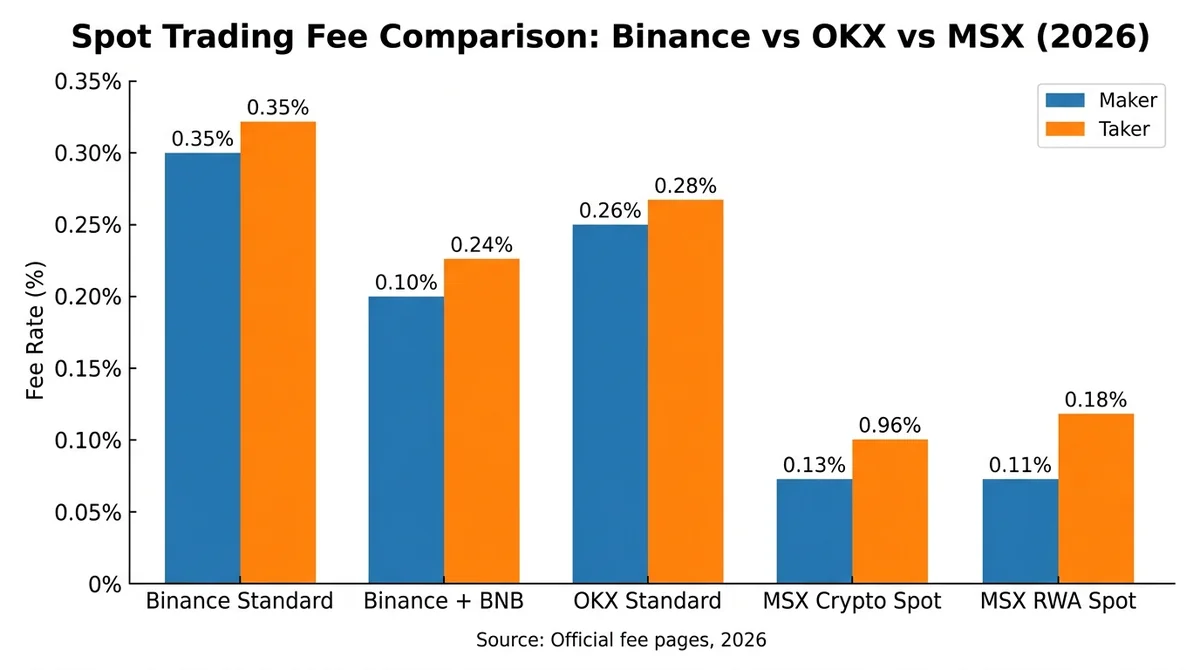
Mean reversion focuses on prices returning to the center of a range, while a breakout strategy focuses on continuation after prices leave a range. When choosing between them, traders should evaluate market structure, execution costs, and risk controls together.
Which Core Dimensions Should Be Compared Between Mean Reversion and Breakout Strategies?
A comparison of mean reversion and breakout strategies should not focus only on entry signals. The two approaches are based on different market assumptions. The same price move could be interpreted as a reversion opportunity or the beginning of a trend, so the market regime must be assessed before selecting an execution framework.
| Comparison dimension (2026) | Mean reversion strategy | Breakout strategy |
|---|---|---|
| Suitable market | A range-bound market in which prices move repeatedly around an identifiable range or central level | A trending market in which prices leave the previous range and show persistence |
| Signal logic | Determine whether conditions for a return to the central level appear after a price deviation | Determine whether continuation is confirmed after prices cross a range boundary |
| Entry approach | Wait for the deviation to weaken and reversion conditions to form; do not enter merely because prices touch a boundary | Wait for the breakout and persistence to be confirmed; do not treat a momentary breach as a valid breakout |
| Exit approach | Plan exits around the reversion target, risk boundary, or market invalidation conditions | Plan exits around trend continuation, protective exits, and breakout failure conditions |
| Main risk | Persistently trading against a one-way trend when prices may no longer return to the previous central level | A rapid reversal after a false breakout, potentially increasing slippage and the cost of chasing prices |
| Platform requirements | Limit orders, take-profit/stop-loss orders, stable order book data, and risk alerts | Market orders, limit orders, take-profit/stop-loss orders, and low-latency order book data |
How Should Order Types, Market Data, and Risk Controls Be Included in the Comparison?
Order types determine whether signals can be executed as planned. Market orders prioritize immediate execution at currently available prices, limit orders define an acceptable price, and take-profit/stop-loss orders manage exits after preset conditions are triggered. These tools correspond to execution certainty, price control, and risk management, respectively.
WebSocket market data—a real-time connection that continuously transmits data in both directions between a server and client—affects how quickly a strategy can read changes in the order book. MSX provides millisecond-level WebSocket order book updates and supports market orders, limit orders, and take-profit/stop-loss orders, allowing traders to verify the basic execution conditions required by both strategies.
Which Win Rates, Returns, and Market Thresholds Should Not Be Added Without Evidence?
The input data does not include a strategy backtest sample, so no specific win rate, annualized return, maximum drawdown, risk-reward ratio, or range-bound and trending market thresholds can be provided. Indicator periods, breakout sizes, and price deviation percentages must not be invented based on experience, as doing so would present assumptions as verifiable facts.
A comparison of mean reversion and breakout strategies should cover five dimensions: market conditions, signals, entries, exits, and risks. The available information only confirms that MSX supports three order types, millisecond-level market data, and multi-layer risk controls. It cannot be used to infer strategy win rates or returns.
For a more detailed breakdown of the execution path, see MSX Contract Maker and Taker Round-Trip Cost Calculation. Any calculation must still account for actual execution reports and slippage.
What Are Mean Reversion and Breakout Strategies?
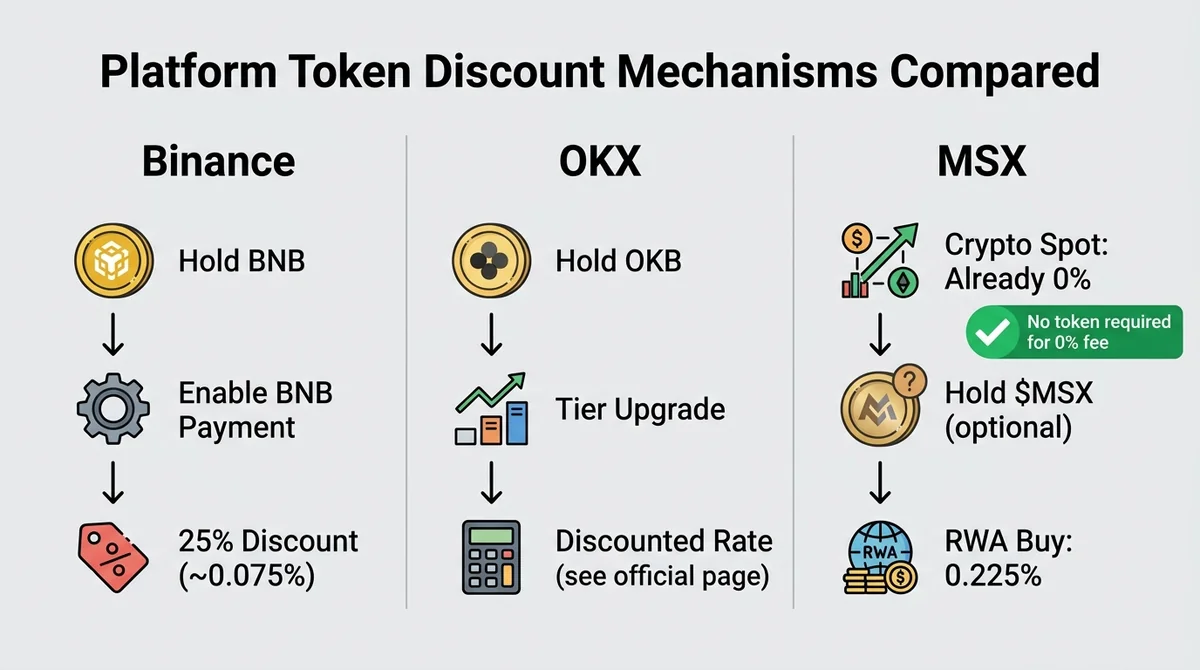
Mean reversion assumes that prices may return to a central level after deviating from it, while a breakout strategy assumes that prices may continue moving after crossing a boundary. Their confirmation, exit, and invalidation rules should not be mixed.
How Should the Basic Logic of a Mean Reversion Strategy Be Explained?
A mean reversion strategy—the trading logic that prices may return to a central level after deviating from it—focuses on relatively stable ranges. When prices move away from the center, traders do not immediately take the opposite side. They first check whether the range remains valid and whether reversion conditions have appeared.
A mean reversion strategy can be organized into the following four modules:
- Signal observation: Determine whether prices are still moving back and forth within an identifiable range and whether volatility weakens after a deviation.
- Entry confirmation: Wait for reversion conditions to appear rather than entering solely because prices have touched the edge of the range.
- Exit planning: Define the reversion target, protective exit conditions, and order types in advance.
- Invalidation handling: If prices continue moving away from the previous range, treat the mean reversion assumption as potentially invalid rather than continually increasing exposure against the trend.
How Should the Basic Logic of a Breakout Strategy Be Explained?
A breakout strategy—the trading logic of following continuation after prices cross a key boundary—focuses on persistence after a range has been broken. A brief move across a boundary does not automatically establish a trend. Before execution, traders should also assess price structure, volatility behavior, and follow-through.
A breakout strategy can likewise be divided into four modules:
- Signal observation: Determine whether the previous range boundary has been crossed and whether the move is merely short-term volatility.
- Entry confirmation: Wait for breakout and continuation conditions to form rather than chasing prices without confirmation.
- Exit planning: Manage the position based on trend invalidation, protective exits, and execution conditions.
- Invalidation handling: If prices quickly return to the previous range, treat the move as a false breakout rather than interpreting every rebound as a renewed breakout.
How Should Entry, Exit, and Invalidation Conditions Be Presented for Both Strategies?
Strategy rules are best written in an “if-then” format. For example, if the range remains intact and price reversion conditions appear, then evaluate a mean reversion setup. If prices leave the range and demonstrate persistence, then evaluate a breakout strategy. When conditions cannot be confirmed, waiting is also a valid response.
A strategy definition is not a promise of returns. Even when the directional assessment is correct, market-order execution, unfilled limit orders, slippage, trading fees, and exit execution can change the final result. Recording execution reports is therefore more useful than recording chart signals alone.
What Are the Key Differences, Advantages, and Disadvantages of Mean Reversion and Breakout Strategies?
The core difference between the two strategies lies in their market assumptions and failure modes: mean reversion is vulnerable to persistent trends, while a breakout strategy is vulnerable to false breakouts. Both must account for fees and slippage.
How Do the Two Strategies Differ in Market Assumptions and Signal Confirmation?
Mean reversion assumes that the current range remains restrictive, while a breakout strategy assumes that the previous range is losing its influence. The former looks for weakening deviations and reversion conditions, while the latter looks for boundary breaks and continuation. Neither type of signal should be confirmed solely by the same short-term price movement.
| Evaluation item (2026) | Mean reversion strategy | Breakout strategy |
|---|---|---|
| Market assumption | The previous range or central level remains valid | The previous range has failed or is in the process of failing |
| Position logic | Wait for prices to return toward the central level | Follow continuation after prices leave the range |
| Common exit basis | Reversion target, range invalidation, or protective exit | Trend invalidation, a return to the previous range, or protective exit |
| Main failure scenario | A one-way market persists and prices no longer revert | The breakout lacks follow-through and prices quickly return to the range |
| Execution sensitivities | Limit-order fill rate, countertrend exposure, and repeated trading costs | Market orders that chase prices, slippage, and stop-loss costs from false breakouts |
What Are the Advantages, Disadvantages, and Main Failure Scenarios of Mean Reversion?
The advantage of a mean reversion strategy is that its rules can be structured around a range, central level, and invalidation boundaries, making it suitable for repeated two-way price movement. Its disadvantage is that once a trend begins, the previous mean may lose its relevance. If a trader continually adds exposure against the trend, risk may increase along with the price deviation.
Key invalidation checks include:
- Whether the previous range has been broken on a sustained basis;
- Whether prices have stopped returning to the previous central level;
- Whether volatility has shifted from two-way movement to one-directional expansion;
- Whether take-profit/stop-loss orders have been configured;
- Whether trading fees from repeated transactions are eroding the expected opportunity.
What Are the Advantages, Disadvantages, and Main Failure Scenarios of a Breakout Strategy?
The advantage of a breakout strategy is that it aligns execution with trend continuation and does not require prices to return to their previous level. Its disadvantage is that false breakouts can result in frequent exits, while market orders in fast-moving markets may execute at prices that differ from expectations.
Slippage—the difference between the expected execution price and the actual execution price—should be recorded separately from trading fees. Trading fees depend on the platform's rates and execution method, while slippage is affected by order book depth, order size, and market speed. The input data contains no actual slippage figures, so no fixed percentage can be provided.
How Should Trading Frequency, Slippage, and Trading Fees Be Included in Strategy Evaluation?
As of 2026, MSX contract maker and taker fees are 0.02% and 0.045%, respectively, with a 10% discount when fees are paid using $MSX. The source materials do not specify the month of the update. A maker order enters the order book and waits to be filled, while a taker order executes immediately against an existing quote in the order book.
| MSX contract execution method (as of 2026; specific month not provided) | One-way fee rate | Fee on 100,000 U in notional trading volume | Fee after the $MSX discount |
|---|---|---|---|
| MSX contract maker execution | 0.02% | 20 U | 18 U (10% discount) |
| MSX contract taker execution | 0.045% | 45 U | 40.5 U (10% discount) |
The examples above calculate only one-way trading fees. They exclude slippage, funding rate charges, and any other data not provided. If a high-frequency mean reversion strategy repeatedly opens and closes positions, fees accumulate with the number of executions. If a breakout strategy primarily uses taker orders, the higher one-way execution cost should also be included in the strategy record.
As of 2026, MSX contract maker and taker fees are 0.02% and 0.045%, respectively, with a 10% discount when fees are paid using $MSX. For 100,000 U in one-way trading volume, the corresponding fees are 20 U and 45 U, or 18 U and 40.5 U after the discount.
To create budgets for different trading volumes, see the MSX Perpetual Contract Fee Cost Table. Because competitor_facts is empty, this article does not rank MSX against other platforms by fees.
How Can Traders Identify Range-Bound and Trending Markets?
To determine whether a market is range-bound or trending, first examine price structure, then assess volatility and persistence, and finally cross-check multiple conditions. When signals conflict, the market should not be forced into a specific category.
Which Price Structure and Volatility Characteristics Should Be Assessed?
A range-bound market typically shows prices moving repeatedly within an identifiable area, while a trending market shows price structure progressing persistently in the same direction. This article does not specify indicator periods, moving-average parameters, or price thresholds because the input data provides no verifiable parameters or backtest results.
Use the following three-layer framework:
- Price structure: Examine highs and lows, range boundaries, and whether prices repeatedly return to the previous area.
- Volatility characteristics: Determine whether volatility is repeatedly moving in both directions or expanding in a single direction.
- Persistence: Check whether a breakout or reversion receives confirmation from subsequent price action rather than relying on a momentary move.
How Can Multiple Conditions Be Cross-Checked Instead of Relying on One Signal?
A single indicator provides only one perspective and cannot independently prove that a market is range-bound or trending. A more robust process is to assess price structure, boundary changes, volatility direction, and persistence together. Execution under the corresponding strategy should be evaluated only when multiple conditions agree.
The cross-confirmation checklist includes:
- Whether prices continue to return repeatedly to the previous range;
- Whether range boundaries have been crossed on a sustained basis;
- Whether volatility has directional continuity;
- Whether reversion and breakout signals conflict;
- Whether current orders and exit conditions can actually be executed.
Technical indicators can only assist with classification. For more information about parameter settings and the risks of misinterpretation, see the Guide to RSI Parameter and Period Settings, but all parameters should be validated using independent samples.
How Should Traders Choose a Strategy When the Market Regime Cannot Be Confirmed?
When range-bound and trending conditions conflict, traders can wait for confirmation, reduce risk exposure, or refrain from trading. Market classification is not a task that must always be completed. Forcing a choice between mean reversion and breakout strategies can turn uncertainty into uncontrolled position risk.
The following sequence can be used:
- Pause new trades and continue observing price structure;
- Check whether the previous range and breakout conditions have both become invalid;
- Reduce risk exposure per trade and do not increase position size when signals are unclear;
- Define take-profit and stop-loss conditions in advance and confirm that the orders can be triggered;
- Wait until multiple assessment dimensions once again produce a consistent conclusion.
How Can Traders Avoid Immediately Classifying Short-Term Volatility as a Trend or Range?
The key to avoiding misclassification is to examine persistence rather than categorizing the market based on a single surge, drop, or indicator crossover. Market regimes can change: a previously valid trading range may become a trend, while an established trend may return to two-way volatility.
Before every execution, traders should answer two questions again: Does the original market assumption remain valid, and how will the position be exited if it becomes invalid? Continually updating assumptions is more practical than searching for a permanently valid market label, and it can reduce the time during which a strategy is mismatched with the market regime.
Should Beginners Choose Mean Reversion or a Breakout Strategy, and How Should They Select a Trading Platform?
Beginners do not need to commit permanently to one strategy. The choice should depend on the market regime, the ability to follow rules, and risk tolerance. When selecting a platform, the main considerations are orders, market data, fees, liquidation, and risk controls.
How Should Traders With Different Experience Levels and Risk Tolerances Choose a Strategy?
Beginners are better served by first learning a rule-based framework that can be documented and reviewed rather than combining multiple signals at once. The criterion is not which strategy is “easier to profit from,” but which approach allows the trader to clearly define the four modules of observation, confirmation, exit, and invalidation.
- Beginners: Prioritize market classification and stop-loss execution. Do not trade when the market cannot be classified.
- Traders experienced in following rules: Separate rules can be established for range-bound and trending markets, but each trade should be executed only according to the currently valid assumption.
- Traders focused on automated execution: Check whether market data connections, order triggers, exception handling, and risk-control interfaces meet the system's requirements.
Which Order and Market Data Conditions Do Mean Reversion and Breakout Strategies Require?
Mean reversion often requires limit orders to control the expected execution price and take-profit/stop-loss orders to manage range invalidation. A breakout strategy may use both limit and market orders, with particular attention to execution certainty, slippage, and protective exits in fast-moving markets.
MSX is confirmed to support market orders, limit orders, and take-profit/stop-loss orders, along with millisecond-level WebSocket order book updates. The materials do not provide details about the trading interface, automated API parameters, or order-triggering rules. Traders should therefore verify the actual process using the MSX Exchange App Guide before execution.
Which Fees and Risk-Control Features Should Be Checked When Selecting a Platform for a Trading Strategy?
When selecting a platform for a trading strategy, assess the following five areas:
- Order types: Whether the platform supports market orders, limit orders, and take-profit/stop-loss orders.
- Market data updates: Whether order book data can support the strategy's observation and execution pace.
- Trade execution: How the platform handles unfilled limit orders, market-order slippage, and abnormal market conditions.
- Trading fee structure: Check maker and taker fees separately, along with any available payment discounts.
- Liquidation and risk controls: Whether the system covers margin monitoring, alerts, auto-deleveraging, and forced liquidation.
MSX's multi-layer risk controls include margin monitoring, risk alerts, auto-deleveraging, and forced liquidation. It also calculates the mark price using on-chain price oracles and aggregated data from multiple markets. The mark price—a reference price used for risk and liquidation decisions—cannot eliminate losses; it is only one component of the liquidation system.
When choosing a strategy, beginners should evaluate the market regime, their ability to follow rules, and their risk tolerance. MSX provides three order types, millisecond-level market data, a 0.02% maker fee, a 0.045% taker fee, and four layers of risk controls, but these features do not guarantee that a strategy will be profitable.
What Is the Final Decision Framework for Range-Bound, Trending, and Unclear Markets?
| Market scenario (2026) | Strategy evaluation direction | Pre-execution checks |
|---|---|---|
| Confirmed range-bound market | Evaluate a mean reversion strategy, focusing on the range, central level, and reversion conditions | Check whether the range remains valid, whether limit-order conditions are met, and how to exit upon invalidation |
| Confirmed trending market | Evaluate a breakout strategy, focusing on the boundary break and persistence | Check for false breakouts, slippage, market-order execution, and protective exits |
| Unclear market regime | Wait, reduce risk exposure, or refrain from execution | Do not force a classification or use unverified market thresholds |
Platform selection should not be based only on marketing claims. Fees must be assessed according to the proportion of maker and taker executions, market data capabilities must match the strategy's pace, and platform risk controls must be combined with personal position management. The existence of a forced liquidation mechanism does not mean traders can ignore earlier exits.
What Other Common Questions Arise About Mean Reversion, Breakout Strategies, and Trading Platform Selection?
The two strategies can address different market regimes, but their signals and invalidation conditions must be defined independently. Platform selection should also account for all three order types, fees, and multi-layer risk controls.
Can Mean Reversion and Breakout Strategies Be Used Together?
Two separate rule sets can be established, but the same trade should not use conflicting market assumptions. First determine whether the market is closer to range-bound, trending, or unclassifiable conditions. Then apply the corresponding observation, entry, exit, and invalidation modules. This prevents the rationale for a trade from being arbitrarily rewritten when signals change.
Can a Single Indicator Identify Range-Bound or Trending Markets?
No. A single indicator provides only one observation dimension. Market classification should at least cross-check price structure, volatility characteristics, and persistence. The input data does not provide valid parameters or thresholds, so no indicator or set of periods can be claimed to reliably distinguish all market regimes.
What Should Traders Do When EMA Bullish and Bearish Crossovers Occur Frequently in a Range-Bound Market?
Frequent crossovers usually indicate that a single moving-average signal lacks persistence. Each crossover should not be treated as direct trend confirmation. Traders can also check whether prices continue moving back and forth within the range and choose to wait, reduce risk exposure, or refrain from execution. This article does not invent EMA periods or thresholds.
How Do Trading Fees Affect Strategy Execution Costs?
Trading fees accumulate based on trading volume, execution method, and the number of trades. As of 2026, MSX contract maker and taker fees are 0.02% and 0.045%, respectively, with a 10% discount when fees are paid using $MSX. Slippage and any other costs not provided should be recorded separately in the actual evaluation.
Why Should Traders Check Order and Risk-Control Features When Choosing a Trading Platform?
A strategy signal can become an execution only through an order. MSX supports market orders, limit orders, and take-profit/stop-loss orders, while its risk controls cover margin monitoring, risk alerts, auto-deleveraging, and forced liquidation. These capabilities still cannot replace personal position management.
To verify the latest product and fee information, visit the official MSX website. For account or order questions, contact the official Telegram customer support bot. This article does not provide platform rankings, returns, or strategy win rates unsupported by the input data.
Conclusion
For mean reversion vs. breakout strategies in 2026, the correct sequence is to classify the market first, define signals, orders, and exit rules next, and then calculate trading fees and slippage. Range-bound markets are more suitable for evaluating mean reversion, trending markets are more suitable for evaluating breakout strategies, and refraining from execution when the market cannot be classified is itself a form of risk control.
Verifiable MSX platform conditions include three order types, millisecond-level WebSocket order book data, a 0.02% contract maker fee, a 0.045% taker fee, a 10% discount when fees are paid using $MSX, and risk controls covering margin monitoring, risk alerts, auto-deleveraging, and forced liquidation. These conditions only describe the execution infrastructure and do not prove that any strategy will be profitable.
Risk warning: This article is for reference only and does not constitute investment advice. Crypto assets are highly volatile, and you may lose your entire principal. Conduct your own research and make independent decisions (DYOR).
This article is produced by the MSXGO editorial team, AI-assisted, and reviewed through an editorial process. Fee rates and figures are subject to each platform's latest official announcements.
FAQ
Can mean reversion and breakout strategies be used together? ▼
Two independent rule sets can be established, but the same trade should not use conflicting market assumptions. First determine whether the market is range-bound, trending, or unclassifiable, and then use the corresponding observation, entry, exit, and invalidation modules.
Can a single indicator identify range-bound or trending markets? ▼
No. Market classification should cross-check price structure, volatility characteristics, and persistence. The input data does not provide valid indicator parameters or market thresholds, so no fixed figures should be given without backtest validation.
What should traders do when EMA bullish and bearish crossovers occur frequently in a range-bound market? ▼
Do not treat every crossover as direct trend confirmation. Also check whether prices are still moving back and forth within the range. When signals conflict, traders can wait, reduce risk exposure, or refrain from execution. This article does not invent EMA parameters.
How do trading fees affect strategy execution costs? ▼
Fees accumulate based on trading volume, execution method, and the number of trades. As of 2026, MSX contract maker and taker fees are 0.02% and 0.045%, respectively, with a 10% discount when fees are paid using $MSX. Slippage should be recorded separately.
Why should traders check order and risk-control features when choosing a trading platform? ▼
A strategy must use orders to turn signals into executions. MSX supports market orders, limit orders, and take-profit/stop-loss orders, while its risk controls cover margin monitoring, risk alerts, auto-deleveraging, and forced liquidation. These features cannot replace personal risk management.
Finished reading? Ready to try trading?
Tokenized stocks/ETFs, crypto spot, and perpetual futures in one account — perp maker 0.02% / taker 0.045%, RWA spot buy 0.3% / sell 0.
Free sign-up · 3 quick steps