US Spot Bitcoin ETF Logs Six-Day Net Inflows of $2.26B: BTC Reclaims $80K, August Up 25%, Greed Index Hits 74 (2026)
US spot Bitcoin ETFs saw $2.26B in six-day net inflows, BTC above $80,000, August up 25%, Greed Index at 74. See sustainability, key levels and risks.
Article Citation Summary
US spot Bitcoin ETFs saw $2.26B in six-day net inflows, BTC above $80,000, August up 25%, Greed Index at 74. See sustainability, key levels and risks.
US Spot Bitcoin ETF Logs Six-Day Net Inflows of $2.26B: BTC Reclaims $80K, August Up 25%, Greed Index Hits 74 (2026)
This article is primarily based on CoinTelegraph reports from August 24–25, 2026. All key figures are sourced, and some inferences have been cautiously qualified.
Core Takeaways / TL;DR:
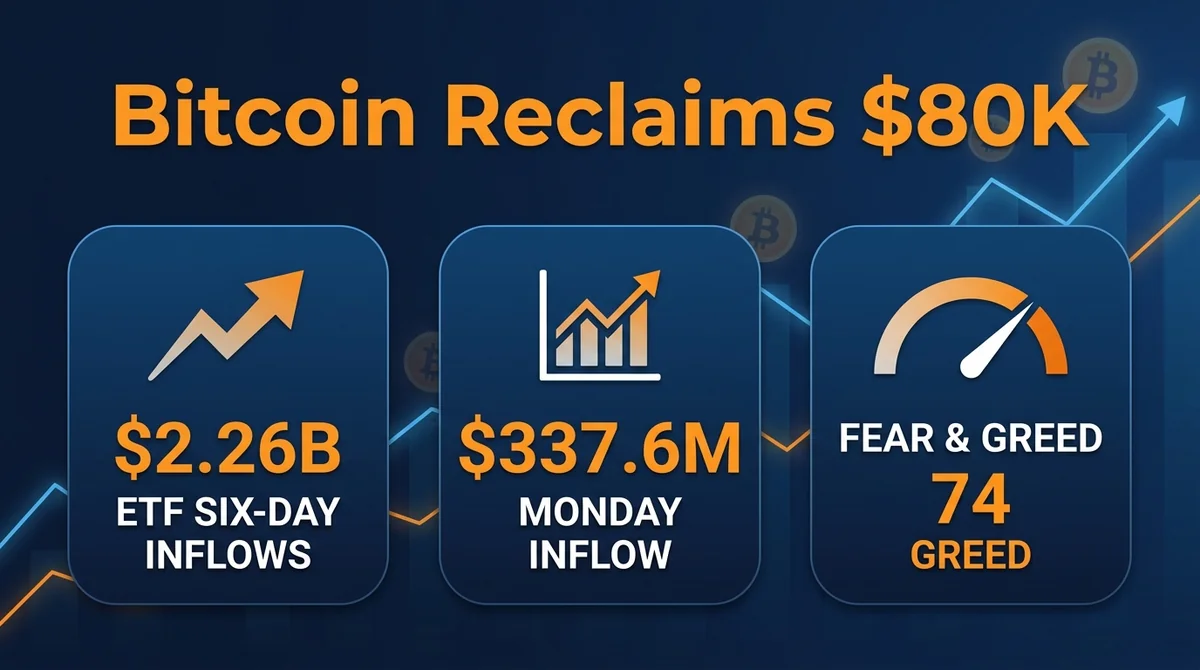
- As of August 24, 2026, Bitcoin price broke above $80,000 for the first time since May 15.
- Over the past 24 hours, crypto short liquidations exceeded $220 million.
- US spot Bitcoin ETFs recorded $337.6 million in net inflows on Monday, marking a sixth consecutive day of net inflows and a six-day total of $2.26 billion.
- Bitcoin is up 25% in August so far, its best August performance since 2017; the Crypto Fear & Greed Index rose to 74, the highest since October 2025.
| Metric | Value | Time/Note |
|---|---|---|
| Bitcoin price | Above $80,000 | August 24, 2026; first time since May 15 |
| 24-hour short liquidations | Over $220 million | As of August 24 |
| ETF single-day net inflow | $337.6 million | Monday (August 24) |
| ETF six-day net inflow | $2.26 billion | Sixth consecutive day |
| Bitcoin August gain | 25% | Best August since 2017 |
| Fear & Greed Index | 74 | Highest since October 2025 |
Bitcoin Reclaims $80K and ETF Six-Day Net Inflows Hit $2.26B: What Happened in the Market?
According to CoinTelegraph data, on August 24 Bitcoin broke above $80,000 (first time since May 15), 24-hour short liquidations exceeded $220 million, spot ETFs recorded a sixth consecutive day of net inflows totaling $2.26 billion, and the Greed Index rose to 74. Below we break down the key details of these three market signals.
What Are the Key Details Behind Bitcoin Breaking Above $80,000?
On August 24, Bitcoin broke above $80,000 for the first time since May 15. On the same day, crypto short liquidations surpassed $220 million. The rally was driven by both short covering and spot buying, although the exact composition still requires on-chain data verification.
How Did Spot ETFs Generate Six-Day Net Inflows of $2.26 Billion?
US spot Bitcoin ETFs recorded $337.6 million in net inflows on Monday, extending a streak of six consecutive days of net inflows and bringing the six-day total to $2.26 billion. Capital was concentrated in spot ETFs, signaling sustained institutional allocation demand rather than futures-leveraged momentum.
What Does the Crypto Fear & Greed Index Rising to 74 Mean?
The Crypto Fear & Greed Index climbed to 74, its highest since October 2025, placing it in 'Greed' territory. The index ranges from 0 to 100, with higher values indicating more greed. When sentiment runs hot, caution is warranted over short-term correction pressure.
Further reading: Why Is the Crypto Market Up Today? Bitcoin Breaks $80K, $220M in Short Liquidations, and Strive Increases Holdings 2026
Why Do Bitcoin Reclaiming $80K and ETF Six-Day Net Inflows of $2.26B Matter for the Market?
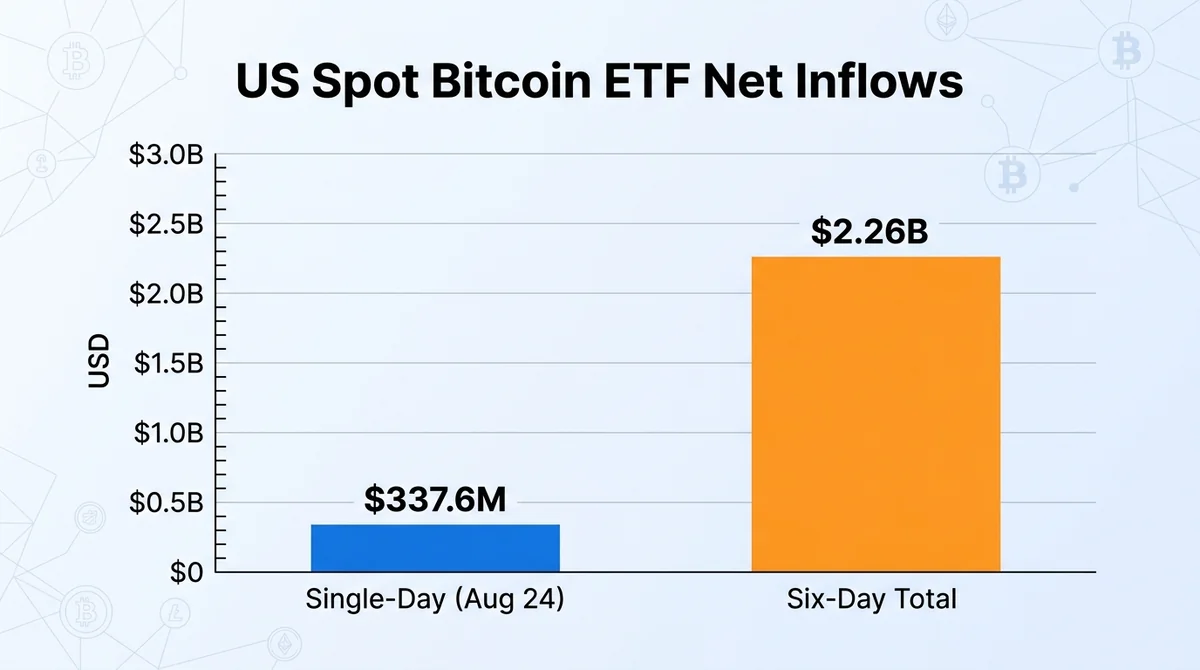
Spot ETFs recording six consecutive days of net inflows totaling $2.26 billion and Bitcoin rising 25% in August so far (its best August performance since 2017) may indicate strong institutional demand and a shift toward greed. Short liquidations exceeding $220 million reflect concentrated release of short-side pressure, though it should be noted that liquidation data sources may differ. Together, these signals may point to near-term market strength.
Why Are Consecutive ETF Net Inflows Viewed as a Bullish Signal?
Spot ETF net inflows directly correspond to underlying Bitcoin buying demand — fund issuers must buy BTC at net asset value to back new shares. Six consecutive days of net inflows totaling $2.26 billion show that institutional capital still has strong willingness to absorb around the $80,000 level, providing demand-side support for price.
Why Is the Best August Performance Since 2017 Worth Attention?
Bitcoin has risen 25% in August so far, marking its best August performance since 2017. August is not typically a strong month for Bitcoin, so this counter-seasonal strength often reflects independent drivers, such as ETF inflows and short covering.
Further reading: Standard Chartered Analyst: Bitcoin Could Rise Toward $126K by Year-End, Spot ETF Single-Day Net Inflow of $517M 2026
How Do Bitcoin Reclaiming $80K and ETF Inflows Affect Bitcoin and Altcoins?
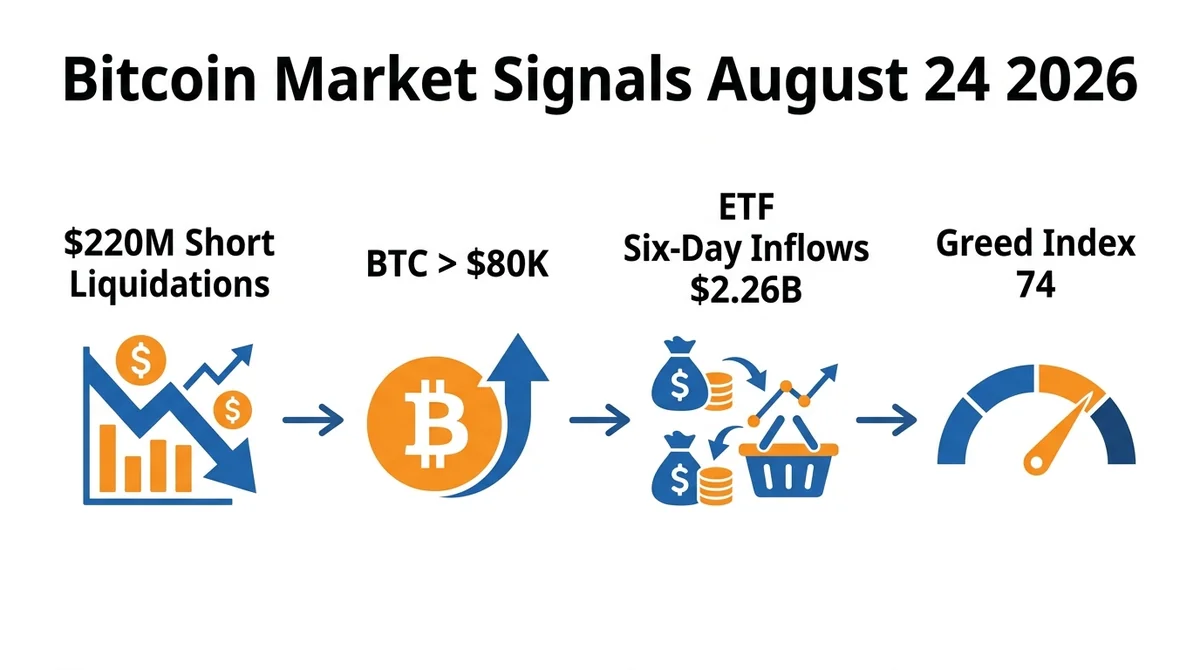
Bitcoin breaking above $80,000 alongside ETF inflows may boost overall crypto market risk appetite, but altcoin performance depends on whether capital rotates out of Bitcoin. Currently capital flows are concentrated in Bitcoin spot ETFs, and the spillover effect on altcoins remains unclear.
How Do ETF Inflows Affect Bitcoin Price Support?
ETF inflows mainly create spot buying in Bitcoin, which may provide more direct price support. Six consecutive days of net inflows totaling $2.26 billion means that even if some short-term traders take profits, institutional buying may still provide liquidity absorption and help Bitcoin hold near $80,000.
Will Altcoins Follow Bitcoin Higher?
Altcoin performance depends on whether capital rotates from Bitcoin. Currently ETF inflows are concentrated in BTC as a single asset, and Bitcoin's capital-sucking effect may temporarily suppress altcoin relative performance. Only when Bitcoin's rally slows and capital seeks higher risk-reward may altcoins see catch-up gains. At this stage, focus on the structure of inflows rather than assuming a broad-based rally.
Under ETF Six-Day Net Inflows of $2.26B and Greed Index 74, How Might the Market Evolve?
Against a backdrop of Greed Index at 74 (highest since October 2025) and ETF six-day net inflows of $2.26 billion, the market may remain strong, but caution is warranted over short-term corrections driven by high greed. The following are scenarios only and do not constitute price predictions.
If ETF Inflows Continue, How Might the Market React?
If spot ETF net inflows maintain a pace of hundreds of millions of dollars per day, Bitcoin may receive sustained buying support above $80,000 and market risk appetite may remain elevated. However, inflows rarely move in a straight line; once a single-day net inflow clearly slows, the market may react quickly.
If the Greed Index Rises Too High, What Corrections Could Occur?
The Fear & Greed Index at 74 is in greed territory, indicating hot short-term sentiment. Historically, after this index reaches elevated levels, the market often sees short-term pullbacks, with magnitude and speed depending on leveraged position size. Current 24-hour short liquidations of $220 million already show rising volatility, and investors should avoid chasing rallies.
What Risks Should Investors Watch in the Current Environment?
The Greed Index rising to 74 and 24-hour short liquidations above $220 million indicate hot sentiment, and investors should guard against short-term volatility and pullback risk. Concentrated liquidation of highly leveraged positions could amplify two-way price swings.
What Risks Does the Market Face After High-Leverage Short Liquidations?
Over the past 24 hours, more than $220 million in short liquidations (according to third-party data) shows that a large number of highly leveraged shorts were forced out. After liquidation, two scenarios may emerge: first, short-covering momentum weakens and the rally loses fuel; second, the market continues a short squeeze, but volatility expands significantly. In either case, highly leveraged traders face greater liquidation risk.
What Risk Does a Greed Index of 74 Imply?
A Greed Index of 74 reflects strong short-term optimism, but sentiment indicators are contrarian references — the higher the reading, the more caution is needed for a sentiment reversal. In a market driven by ETF flows, once sentiment turns, outflows can be just as rapid. Controlling position size and avoiding excessive leverage are basic risk management in the current environment.
Further reading: Bitcoin ETF Seven-Day Winning Streak Ends, Poolin Mining Pool Bankruptcy: Full Analysis of Multiple BTC Market Pressures 2026
What Key Indicators and Events Should Investors Track Next?
Investors should next monitor spot ETF flow changes, key Bitcoin price levels, and macro commentary (such as Scott Bessent-related remarks) for potential impact on BTC prices.
What ETF Flow Data Should You Watch?
Daily US spot Bitcoin ETF net inflow/outflow data is a core variable. Watch whether net inflows continue, whether single-day inflows shrink, and whether consecutive net outflows emerge. These changes often lead price turning points.
What Are the Key Bitcoin Price Levels?
$80,000 is the primary psychological level; holding above it opens room to the upside, while losing it could lead to a retest of the upper bound of the recent range before the breakout. However, price levels are only reference points; actual trading should be confirmed with volume and flow data.
How Could Scott Bessent's Comments Affect BTC Price?
The market is highly sensitive to macro policy commentary. Public remarks by US Treasury Secretary Scott Bessent could influence dollar liquidity and risk asset appetite. However, as of this writing, there are no specific facts to cite regarding related commentary or market impact. Investors should follow authoritative releases and avoid making trading decisions based on unverified information.
Further reading: US Treasury 'Non-QE' Buybacks Fuel 23% Bitcoin Rebound; Crypto Stocks and Mining Stocks Rise Together 2026
Frequently Asked Questions (FAQ)
Q: Why did Bitcoin price break above $80,000 in August 2026?
A: It was mainly driven by six consecutive days of US spot Bitcoin ETF net inflows totaling $2.26 billion, with sustained institutional buying. Meanwhile, 24-hour short liquidations exceeded $220 million, and short covering accelerated the rally. Source: CoinTelegraph, August 2026.
Q: What does $2.26 billion in six-day US spot Bitcoin ETF net inflows mean?
A: It shows that institutional capital still has strong allocation willingness near $80,000, providing demand-side support for Bitcoin's price. Consecutive net inflows are generally viewed as a bullish signal, but it remains important to watch whether subsequent flows continue.
Q: What does a Crypto Fear & Greed Index of 74 mean, and how does it affect the market?
A: The index ranges from 0 to 100, and 74 is in greed territory, the highest since October 2025, reflecting hot market sentiment. Historical experience shows high greed often comes with short-term pullback risk, so investors should stay alert for sentiment reversals.
Q: Why did Bitcoin rise 25% in August?
A: Bitcoin has risen 25% in August so far, its best August performance since 2017, mainly driven by spot ETF inflows and short liquidations. August is not usually a strong month, so the counter-seasonal rally suggests independent drivers are dominant.
Q: What regulatory restrictions do US users face when trading crypto derivatives?
A: In the US, crypto derivatives trading is regulated by the Commodity Futures Trading Commission (CFTC), and many offshore platforms do not serve US users. Compliant alternatives include regulated spot ETFs and licensed exchanges, and users must complete KYC and comply with local regulations.
Q: What compliance requirements do US investors face when trading Bitcoin ETFs?
A: US spot Bitcoin ETFs are regulated by the SEC, and investors must buy through a licensed broker account. Unregistered overseas exchanges may not serve US users; verify platform compliance before trading.
Q: Where are the key support and resistance levels after Bitcoin breaks above $80,000?
A: $80,000 is the primary psychological level; holding above it puts the focus on previous highs, while losing it could see a retest of the upper bound of the range before the breakout. Actual trading should be confirmed with volume and flow data.
Q: How should you manage leverage trading risk with a Greed Index of 74?
A: A Greed Index of 74 signals hot sentiment. At such times, reduce leverage, avoid chasing rallies, and set stop losses. Historical experience shows high greed often accompanies short-term pullbacks, so position control is basic risk management.
Reference sources:
- [CoinTelegraph: Bitcoin price hits $80K as 24-hour crypto short liquidations pass $220M](https://cointelegraph.com/markets/bitcoin-price-hits-80k-as-24-hour-crypto-short-liquidations-pass-m?utm_source=rss_feed
This article is produced by the MSXGO editorial team, AI-assisted, and reviewed through an editorial process. Fee rates and figures are subject to each platform's latest official announcements.
FAQ
为什么比特币价格在2026年8月突破80,000美元? ▼
主要受美国现货比特币ETF连续六日净流入22.6亿美元推动,机构买盘持续;同时过去24小时空头清算超2.2亿美元,空头回补加速涨势。数据来源:CoinTelegraph,2026年8月。
美国现货比特币ETF六日净流入22.6亿美元意味着什么? ▼
表明机构资金在80,000美元附近仍有较强配置意愿,为比特币价格提供需求侧支撑。连续净流入通常被视为看涨信号,但需关注后续资金流是否持续。
加密恐惧与贪婪指数74代表什么?对市场有何影响? ▼
该指数为0—100,74处于贪婪区间,创2025年10月以来最高,反映市场情绪偏热。历史经验显示高贪婪往往伴随短期回调风险,投资者应警惕情绪反转。
比特币8月涨25%是什么原因? ▼
比特币8月迄今上涨25%,创2017年以来最佳8月表现,主要受现货ETF资金流入和空头清算推动。8月通常并非传统强月,反季节性上涨显示独立驱动因素占主导。
美国用户交易加密货币合约面临哪些监管限制? ▼
在美国,加密货币衍生品交易受商品期货交易委员会(CFTC)监管,许多海外平台不对美国用户开放。合规替代渠道包括受监管的现货ETF和持牌交易所,用户需完成KYC并遵守当地法规。
Finished reading? Ready to try trading?
Tokenized stocks/ETFs, crypto spot, and perpetual futures in one account — perp maker 0.02% / taker 0.045%, RWA spot buy 0.3% / sell 0.
Free sign-up · 3 quick steps