How to Set RSI Parameters? 2026 Guide to Periods, Overbought/Oversold Thresholds & Crypto Futures Configuration
Complete RSI setup guide: choosing 14/9/6 periods, when 70/30 thresholds fall short in crypto futures, adjusting to 80/20 in strong trends, and live validation on MSX.
Article Citation Summary
Complete RSI setup guide: choosing 14/9/6 periods, when 70/30 thresholds fall short in crypto futures, adjusting to 80/20 in strong trends, and live validation on MSX.
How to Set RSI Parameters? 2026 Guide to Periods, Overbought/Oversold Thresholds & Crypto Futures Configuration
Key Takeaways TL;DR
- The default RSI period of 14 suits daily/4-hour mid-to-long-term trading; crypto futures short-term traders typically shorten it to 9 or even 6
- Overbought/oversold thresholds are not fixed: use the default 70/30 for ranging markets, and consider raising to 80/20 during strong trends
- Crypto market volatility is far higher than traditional markets — copying default stock RSI settings will generate excessive false signals
- RSI is a lagging indicator; using it alone carries high false-signal risk — combine it with Bollinger Bands or moving averages to filter signals
- After configuring parameters, always backtest across at least 3–6 months of data covering both trending and ranging market conditions
Before You Start: What Do You Need to Know Before Setting RSI Parameters?
RSI (Relative Strength Index) measures momentum by calculating the ratio of gains to losses over a defined period. Before setting parameters, you need to clarify your trading style and risk tolerance — crypto futures markets are far more volatile than traditional markets, and applying default settings can produce a flood of false signals.
How Does the RSI Indicator Calculate Its Values?
RSI is built on the concept of "relative strength": it calculates the ratio of the sum of upward closing moves to the sum of downward closing moves over a specified period, then maps the result to a 0–100 scale. A shorter period makes the indicator more sensitive to price changes and generates more frequent signals; a longer period smooths the curve and produces more reliable but laggier entry signals.
This calculation logic leads to one critical conclusion: the period parameter is the most important lever you can pull with RSI — it directly determines signal frequency, the proportion of false signals, and how early or late entries occur.
What Trading Goals Should You Define Before Adjusting RSI Parameters?
Before touching any numbers, answer three questions:
- Trading style: Are you trend-following, range-trading, or scalping futures? Different styles call for different optimal periods.
- Time frame: Do you primarily use daily, 4-hour, or short-term 1-hour/15-minute charts? Your time frame sets the upper bound for your period choice.
- Risk tolerance: Leverage in futures trading multiplies losses from RSI false signals — this must be factored into your parameter selection from the start.
Without clear trading goals, adjusting parameters is just random number shuffling.
What Are the Special Risks of Using RSI in Crypto Futures?
Annualized volatility in crypto markets is typically several times that of traditional equity markets. This has two direct consequences:
- Traditional default settings (period 14, thresholds 70/30) will trigger frequent false signals in high-volatility environments
- During strong one-directional moves, RSI can remain above 70 for days or even weeks while price continues to rise — blindly shorting into this is extremely high-risk
Risk Warning: RSI is fundamentally a lagging indicator — it reflects price momentum that has already occurred, not a prediction of future direction. Relying solely on RSI signals to open positions in crypto futures carries significant false-signal liquidation risk.
Step 1: How to Determine the Base RSI Period
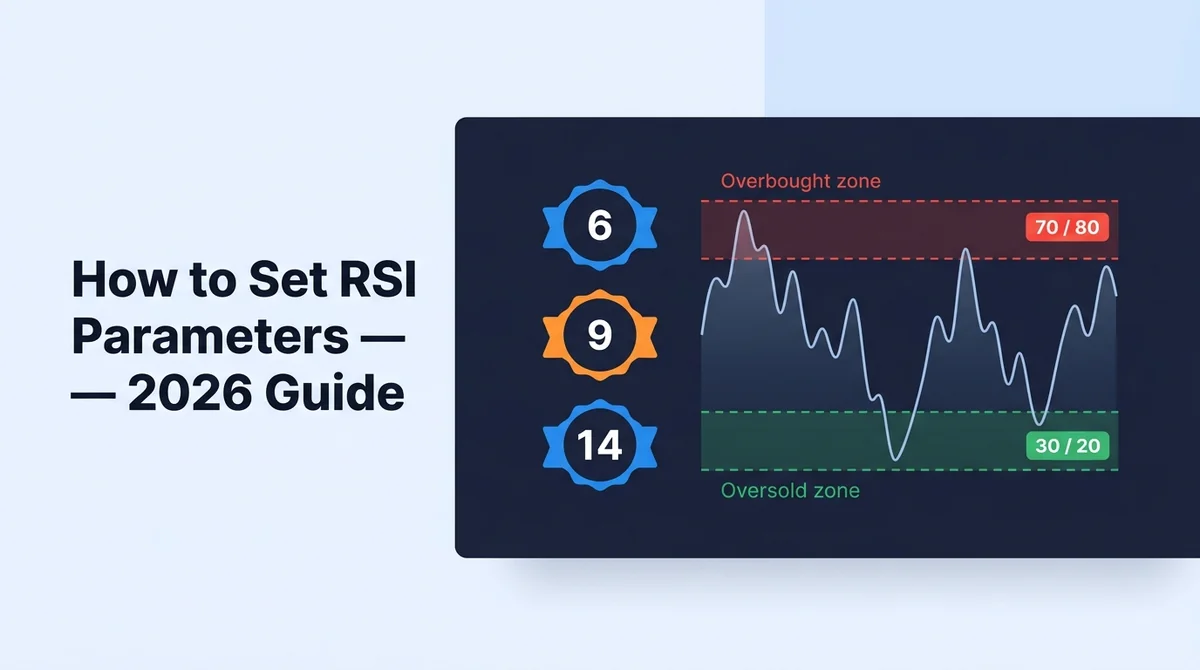
The core principle for setting RSI periods: shorter periods are more responsive but generate more false signals; longer periods are more stable but lag on entries. Crypto futures short-term traders typically shorten the period from the default 14 down to 9 or even 6, paired with the corresponding time frame.
When Is the Standard 14-Period RSI the Right Choice?
14 is the industry default, originating from J. Welles Wilder's original specification in 1978. It works well for:
- Daily chart trend analysis and mid-to-long-term position management
- 4-hour chart swing trading, where signal quality and frequency are relatively balanced
- Analyzing major coins with moderate volatility (BTC, ETH)
The limitation of the 14-period setting: in high-frequency futures trading, its reaction speed often can't keep up with the rapid reversals common in crypto markets.
Which RSI Period Is Recommended for Short-Term Futures Trading?
Common period configurations for different short-term scenarios:
| Period | Applicable Time Frame | Signal Characteristics | Best For |
|---|---|---|---|
| 14 | Daily / 4-hour | Stable, relatively lagging | Mid-to-long-term trend trading |
| 9 | 1-hour / 15-minute | More responsive, moderate false signals | Common short-term futures configuration |
| 6 | 5-minute / 15-minute | Highly sensitive, high noise | Scalping / high-frequency strategies |
The 9-period RSI is the most widely used among crypto futures short-term traders, striking a reasonable balance between sensitivity and signal quality. The 6-period reacts faster but produces significantly more false signals, requiring stricter filtering mechanisms to compensate.
How Should Periods Be Matched to Different Time Frames?
Time frames and RSI periods must be aligned — otherwise you fall into the overfitting trap of "acting against the higher time frame trend based on a lower time frame RSI signal." A practical configuration principle:
- The shorter your primary time frame, the shorter your RSI period should be
- Cross-check the RSI direction on the next higher time frame to confirm trend alignment
- Example: if you're scalping on the 15-minute chart with RSI set to period 9, also check whether the 14-period RSI on the 1-hour chart points in the same direction
For a full comparison of futures trading costs across platforms, see 2026 Lowest Perpetual Futures Fee Exchanges: MSX vs Binance vs OKX Maker/Taker Fee Rate Comparison.
Step 2: How to Find the RSI Settings Panel on a Futures Trading Platform
On major futures platforms like MSX, the RSI settings are typically found in the chart's indicator library — search for RSI, click to add it, and you'll reach the parameter configuration panel where the three core fields are Period, Overbought, and Oversold.
Where Is the Indicator Panel on Major Futures Platforms?
The workflow is consistent across most futures platforms:
- Open the candlestick chart for your chosen futures pair
- Click the "Indicators" button at the top or side of the chart
- Type RSI in the search box
- Click "Relative Strength Index" from the results to add it to the chart
- Click the settings icon (⚙️) next to the added indicator to open the parameter editor
How to Pull Up the RSI Indicator on the MSX Futures Interface?
MSX's futures platform integrates TradingView charts, so the workflow matches the standard process above. Once RSI is added, the key fields in the settings panel are:
- Period: Default 14 — change to 9 or 6 based on the logic above
- Overbought: Default 70
- Oversold: Default 30
- Source: Usually "Close" (closing price) — leave this at the default
What Does Each Field in the Parameter Panel Mean?
| Field | Meaning | Default | Notes |
|---|---|---|---|
| Period | Calculation period | 14 | Number of candles used in RSI calculation |
| Overbought | Overbought threshold | 70 | RSI above this level is considered overbought |
| Oversold | Oversold threshold | 30 | RSI below this level is considered oversold |
| Source | Calculation basis | Close | Use closing price — not recommended to change |
Practical tip: After adjusting parameters, save them as a custom template (most platforms offer a "Save as Template" option in the settings panel) so you don't have to reconfigure every time you switch trading pairs.
Step 3: How Should Overbought and Oversold Thresholds Be Set?
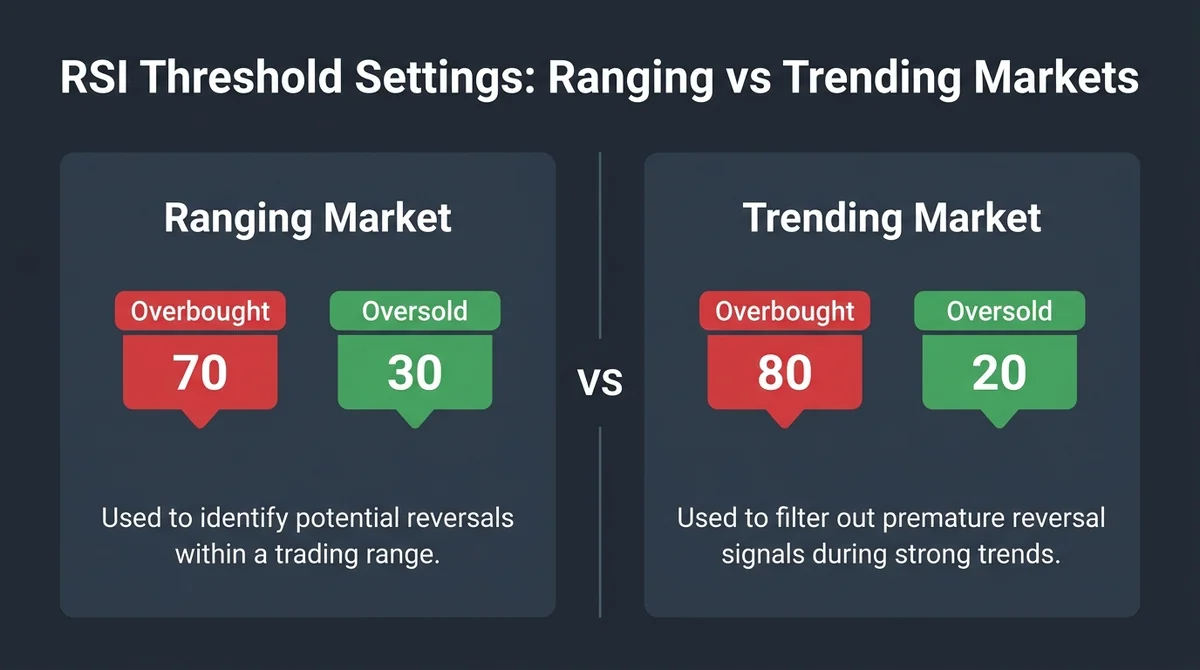
RSI overbought/oversold thresholds are not fixed standards: the default 70/30 suits ranging markets, but in crypto futures during strong trends, thresholds typically need to be raised to 80/20 — otherwise you'll exit profits too early or open counter-trend positions by mistake, missing the continuation move or taking unnecessary losses.
Are the Default 70/30 Thresholds Still Relevant in Crypto Futures?
In ranging markets (where price oscillates within a defined band), 70/30 is a reasonable starting point. But crypto futures have their own dynamics:
- During extreme moves, RSI can stay above 70 for days or even weeks while price keeps rising
- Using 70 as a sell/short signal in a bull trend leads to repeated counter-trend losses
- The high-volatility characteristics of the 2026 crypto market make the assumption "RSI hits 70 = reversal" far less reliable than in traditional equity markets
How Should Thresholds Be Adjusted During Strong Trends?
Threshold adjustment logic for trending conditions:
- Strong uptrend: Raise overbought to 80, raise oversold to 40–45 (a pullback into the relatively strong zone is treated as support)
- Strong downtrend: Lower oversold to 20, lower overbought to 55–60 (a bounce into the relatively weak zone is treated as resistance)
- Use moving averages (e.g., 20-day/50-day MA) to help confirm the trend before deciding whether to switch threshold configurations
What Is the Difference Between Threshold Strategies for Ranging vs. Trending Markets?
| Market Type | Overbought | Oversold | Trading Logic |
|---|---|---|---|
| Ranging market | 70 | 30 | Fade the extremes — trade against the boundary |
| Strong uptrend | 80 | 40–45 | Only consider longs on oversold dips — avoid shorting |
| Strong downtrend | 55–60 | 20 | Only consider shorts on overbought bounces — avoid longing |
| Uncertain / transitioning | 70 | 30 | Reduce position size, wait for clarity |
Practical signal filter: Combine Bollinger Bands (a volatility channel based on price standard deviation) with RSI — only execute a trade when RSI hits the threshold and price simultaneously touches a Bollinger Band boundary. This effectively filters out false breakout signals that RSI would generate on its own.
For indicator combination strategies in crypto futures, see the practical approach in SUIUSDT Perpetual Futures Trading Guide 2026: Open Position Workflow, Funding Rate & MSX Full Walkthrough.
Step 4: How to Validate and Finalize Your RSI Parameters
After configuring RSI parameters, historical backtesting is mandatory — covering at least 3–6 months of candlestick data that includes both trending and ranging market structures. When deploying live on the MSX futures platform, you also need to pair your setup with the platform's multi-layer risk controls — margin monitoring, risk alerts, and auto-deleveraging — to ensure you have a safety net when parameters underperform.
How to Backtest RSI Parameter Validity Using Historical Candlestick Data?
Backtesting isn't about eyeballing historical charts and cherry-picking where signals "worked" — it's systematic validation. Basic steps:
- Select your backtest window: Cover the last 3–6 months, and make sure it includes at least one clear trending phase and one ranging phase
- Log every signal: Entry price, stop-loss level, and take-profit target each time RSI triggers the threshold
- Track core metrics: Win rate (profitable trades / total trades), profit factor (average win / average loss), maximum drawdown
- Compare multiple parameter sets: Test at least 2–3 combinations to avoid survivorship bias from a single sample
- Watch for overfitting: If a parameter set looks "too perfect" on historical data, live performance will almost certainly degrade
How to Save Validated Parameters and Sync Them to Live Trading?
- In the TradingView chart, save your tuned RSI parameters as a custom indicator template
- Keep your live account and test account separate — start with a small position size (no more than 5% of total capital) and run it for 1–2 weeks to observe live performance
- Keep your backtest records documented for easy comparison against live trading deviations
What Safety Checks Are Needed Before Going Live?
MSX's futures platform has a built-in multi-layer risk control system. Confirm the following before going live:
- Margin monitoring: Verify that margin ratio alert thresholds are configured on your account
- Risk alerts: Enable push notifications for when position losses reach a defined percentage
- Stop-loss orders: Every futures position opened on RSI signals must have a stop-loss order attached — do not rely on RSI signals alone to close positions
- Position sizing: Keep individual position size within 5% of total account capital; set leverage according to current volatility
MSX also combines on-chain price oracles with multi-market data aggregation to calculate the Mark Price (the price used to trigger liquidation, distinct from the real-time last trade price — this prevents irrational liquidations from momentary price wicks), providing an additional layer of position safety.
Common Mistakes to Avoid When Setting RSI Parameters
The most common mistake in RSI parameter configuration is directly reusing parameters that someone else validated on a specific asset. Different crypto assets have vastly different volatility profiles — the optimal RSI period and thresholds for BTC versus a high-volatility altcoin futures contract are often completely different. Copying someone else's settings almost always leads to a significant gap between live results and backtest performance.
Why Does Copying Other People's RSI Parameters Lead to Losses?
Different crypto assets move at entirely different rhythms:
- BTC: The largest by market cap, relatively stable volatility — the 14-period RSI has some reference value on the daily chart
- ETH: Highly correlated with BTC but with more elasticity — short-term parameters can be slightly shorter than BTC
- High-volatility altcoins: Volatility can be 3–5x that of BTC — the same period settings will generate far more false signals and require shorter periods combined with stricter filters
Copying a parameter set from a community or forum is essentially borrowing someone else's optimization results for a specific asset in a specific historical market condition. Applying it to your own trading pair in current market conditions gives you essentially zero fit.
How Should RSI Divergence Signals Be Correctly Interpreted?
RSI divergence (where price makes a new high/low but RSI fails to confirm) is a frequently misused signal:
- Divergence does not mean immediate reversal: A divergence signal can remain pending for dozens of candles while price continues in the same direction
- The correct way to use divergence signals: wait for a confirmation candle (e.g., an engulfing pattern, a gap, or an abnormal volume spike) before entering
- Opening a counter-trend position in crypto futures on a divergence signal alone without a stop-loss is one of the most common causes of major losses
What Are the Dangers of Over-Optimizing Parameters?
Overfitting — where parameters perform exceptionally well on historical data but fail in live trading — is the most dangerous trap in technical indicator configuration:
- Signs of overfitting: win rates above 70–80% over a specific historical window that immediately collapse in a different period
- How to avoid it: validate with out-of-sample data — test your parameters on a separate historical period that was not used during optimization
- Frequently adjusting parameters to chase recent market themes is also a common cause of losses — parameters should be set based on trading logic, not hot trends
Safety Notes: What to Watch Out for When Using RSI Signals in Crypto Futures
When using RSI signals in crypto futures, the greatest risk is that leverage multiplies losses from false signals many times over. MSX's futures platform has a built-in multi-layer risk control system — margin monitoring, risk alerts, auto-deleveraging (ADL), and forced liquidation — combined with on-chain price oracles and multi-market data for Mark Price calculation, which helps reduce the risk of irrational liquidations during extreme market conditions.
How Large Is the Combined Risk of RSI Signals and Leveraged Futures?
A simple mathematical relationship illustrates the issue:
- In spot trading, a false RSI signal means entry error — the loss equals the price drawdown percentage
- With 10x leverage in futures, the same false signal amplifies your loss tenfold — a 2% price drawdown wipes out 20% of your margin
- During extreme market events (major news, large liquidation cascades), an RSI signal can be immediately overwhelmed by the opposing move before your stop-loss has a chance to trigger
Core principle: In crypto futures, RSI should only ever be one reference signal among several — never the sole basis for a trading decision.
How to Use MSX's Multi-Layer Risk Controls to Protect RSI Strategy Positions?
MSX's risk control system consists of the following layers:
| Risk Control Layer | Mechanism | Protection for RSI Strategies |
|---|---|---|
| Margin monitoring | Real-time tracking of account margin ratio | Catches position losses that exceed expectations early |
| Risk alerts | Triggers notification when margin ratio falls below preset threshold | Gives traders a window to intervene manually |
| Auto-deleveraging (ADL) | Automatically reduces high-profit counter positions during extreme conditions | Reduces overall system liquidation risk |
| Forced liquidation | Executes when margin ratio hits the liquidation threshold | Last-resort mechanism to prevent account deficit |
| Mark Price | Calculated from on-chain oracles + multi-market data | Prevents irrational liquidations from momentary price wicks |
Practical recommendations:
- Every position opened on an RSI signal must have a stop-loss order placed simultaneously
- Periodically check your margin ratio while holding futures positions — don't set it and forget it
- If the platform offers Portfolio Margin (cross-asset margin), you can use multiple on-chain assets as combined collateral to reduce liquidation sensitivity on individual positions
For operational issues or account problems, reach out via the Official Telegram Support Bot or official website live chat.
For the complete MSX futures platform usage guide, see MSX Exchange App Complete Guide 2026: Registration, Spot & Perpetual Futures Full Walkthrough.
Frequently Asked Questions
Q1: What Is the Most Common RSI Period? Which Period Should Crypto Futures Short-Term Traders Use?
The traditional default is 14 periods, suitable for mid-to-long-term trading on daily and 4-hour charts. For crypto futures short-term trading (1-hour/15-minute timeframes), traders typically shorten it to 9 periods. Scalpers seeking higher signal frequency sometimes use 6 periods, but false signal volume increases proportionally. Period selection must align with the time frame you're trading.
Q2: Should RSI Overbought/Oversold Thresholds Be Set at 70/30 or 80/20?
Both threshold sets serve different market conditions: 70/30 suits ranging markets, where price oscillates within a relatively fixed band and signal accuracy is higher. 80/20 suits strong trending markets — especially in crypto bull runs where RSI can sustain above 70 while price keeps climbing, making 70 as a short signal a recipe for repeated losses. In practice, assess the current market structure first, then decide which threshold set to apply.
Q3: What Is the Core Logic for Optimizing RSI Parameters in Crypto Futures Trading?
The core logic follows a three-step process: asset-fit → time frame alignment → backtest validation. First, determine your period range based on the volatility profile of your trading asset (BTC/ETH vs. high-volatility altcoins). Next, fine-tune based on your operating time frame. Finally, validate parameter effectiveness using at least 3–6 months of historical data spanning both trending and ranging conditions — never copy someone else's parameters directly.
Q4: Can RSI Divergence Signals Be Used Directly to Open Futures Positions?
Direct entry is not recommended. RSI divergence (where price and indicator direction diverge) signals weakening momentum, but it does not mean an immediate reversal — price can continue in the same direction for dozens of candles after a divergence appears. The correct approach is to wait for additional confirmation signals (specific candlestick patterns, unusual volume) before entering, and always attach a stop-loss order regardless of circumstances.
Q5: What Are the Optimal EMA Parameters for Crypto Futures Trading?
EMA (Exponential Moving Average, which weights recent prices more heavily) commonly used parameter combinations in crypto futures: use 9/21 EMA for short-term golden/death cross trend direction; use 50/200 EMA for mid-to-long-term trend filtering. When combining with RSI, the standard approach is to use EMA to confirm the macro trend direction first, then use RSI to time short-term momentum entries — this effectively reduces the false signal rate that comes from using RSI in isolation.
Q6: What Preparations Are Required Before Going Live After Setting RSI Parameters?
Pre-live checklist: ① Complete at least 3 months of historical backtesting covering both trending and ranging market conditions; ② Confirm every entry has a stop-loss order attached; ③ Keep individual position size within 5% of total capital; ④ Confirm platform margin alert thresholds are activated; ⑤ Run with a small position size for 1–2 weeks to observe the gap between live and backtest performance before scaling up.
This article is produced by the MSXGO editorial team, AI-assisted, and reviewed through an editorial process. Fee rates and figures are subject to each platform's latest official announcements.
FAQ
What Is the Most Common RSI Period? Which Period Should Crypto Futures Short-Term Traders Use? ▼
The traditional default is 14 periods, suitable for mid-to-long-term trading on daily and 4-hour charts. For crypto futures short-term trading (1-hour/15-minute timeframes), traders typically shorten it to 9 periods. Scalpers seeking higher signal frequency sometimes use 6 periods, but false signal volume increases proportionally. Period selection must align with the time frame you're trading.
Should RSI Overbought/Oversold Thresholds Be Set at 70/30 or 80/20? ▼
Both threshold sets serve different market conditions: 70/30 suits ranging markets; 80/20 suits strong trending markets — especially in crypto bull runs where RSI can sustain above 70 while price keeps climbing, making 70 as a short signal a recipe for repeated losses. In practice, assess the current market structure first, then decide which threshold set to apply.
What Is the Core Logic for Optimizing RSI Parameters in Crypto Futures Trading? ▼
The core logic follows a three-step process: asset-fit → time frame alignment → backtest validation. First, determine your period range based on the volatility profile of your trading asset (BTC/ETH vs. high-volatility altcoins). Next, fine-tune based on your operating time frame. Finally, validate using at least 3–6 months of historical data spanning both trending and ranging conditions — never copy someone else's parameters directly.
Can RSI Divergence Signals Be Used Directly to Open Futures Positions? ▼
Direct entry is not recommended. RSI divergence signals weakening momentum but does not mean an immediate reversal — price can continue in the same direction for dozens of candles after a divergence appears. The correct approach is to wait for additional confirmation signals (specific candlestick patterns, unusual volume) before entering, and always attach a stop-loss order regardless of circumstances.
What Are the Optimal EMA Parameters for Crypto Futures Trading? ▼
Commonly used EMA parameter combinations in crypto futures: use 9/21 EMA for short-term golden/death cross trend direction; use 50/200 EMA for mid-to-long-term trend filtering. When combining with RSI, use EMA to confirm the macro trend direction first, then use RSI to time short-term momentum entries — this effectively reduces the false signal rate from using RSI alone.
What Preparations Are Required Before Going Live After Setting RSI Parameters? ▼
Pre-live checklist: ① Complete at least 3 months of historical backtesting covering both trending and ranging conditions; ② Confirm every entry has a stop-loss order attached; ③ Keep individual position size within 5% of total capital; ④ Confirm platform margin alert thresholds are activated; ⑤ Run with a small position size for 1–2 weeks to observe the gap between live and backtest performance before scaling up.
Finished reading? Ready to try trading?
Tokenized stocks/ETFs, crypto spot, and perpetual futures in one account — perp maker 0.02% / taker 0.045%, RWA spot buy 0.3% / sell 0.
Free sign-up · 3 quick steps