Is Bitcoin's Breakout Real? Why $83,000 Is the Key Line for a Trend Reversal
Bitcoin surged nearly 30% in eight days, breaking the bull market support line and 200-day MA. We assess breakout validity via $83,000 resistance and cycle history.
Article Citation Summary
Bitcoin surged nearly 30% in eight days, breaking the bull market support line and 200-day MA. We assess breakout validity via $83,000 resistance and cycle history.
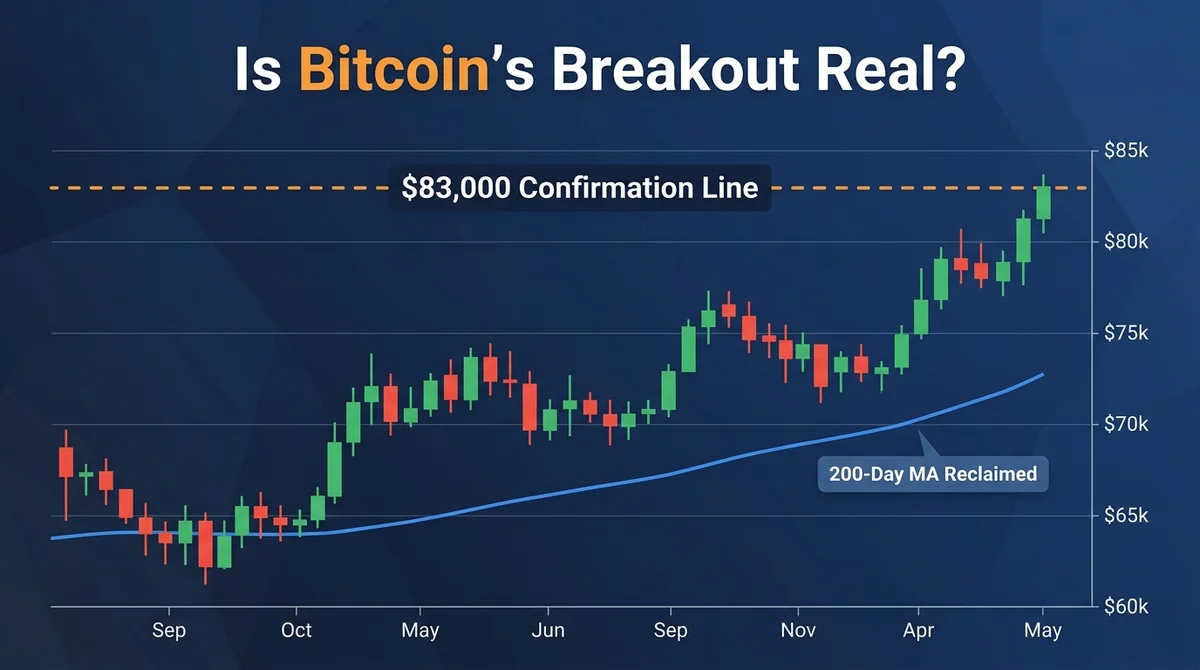
Bitcoin rallied rapidly from around $64,000 to above $81,000 in just eight trading days, a gain of nearly 30%. This rebound broke through two key long-term indicators at once: the bull market support line and the 200-day moving average. The market is now debating one central question: is this a valid trend-reversal breakout, or just another fakeout? This article lays out the reasoning from three angles: technical structure, key resistance levels, and comparison with historical cycles. The following is subjective technical analysis based on public charts and historical price action, and does not constitute investment advice.
1. Why $83,000 Is the Confirmation Line for a Trend Reversal
The key level to watch in judging whether this breakout is valid is the $83,000 to $84,000 range. This zone matters because of May's rebound high this year: Bitcoin rallied to around $82,700 before pulling back, forming a local high.
If this rebound cannot clear that prior high, then structurally it remains only a lower high. Since last October, Bitcoin has continued to print lower highs and lower lows, remaining in an overall downtrend, which can also be understood as a bear market structure. Until price decisively breaks above $83,000, this downtrend has not been technically invalidated.
Conversely, once Bitcoin holds above $83,000, it can be confirmed that this bear market's low most likely occurred near $57,000. If it fails to break through, there remains a small probability of printing a lower low, i.e., refreshing this cycle's low. Although this rapid breakout has greatly reduced the odds of that scenario, based on the current structure the probability is still around 20% to 25%.
2. Short-Term Resistance Is Normal
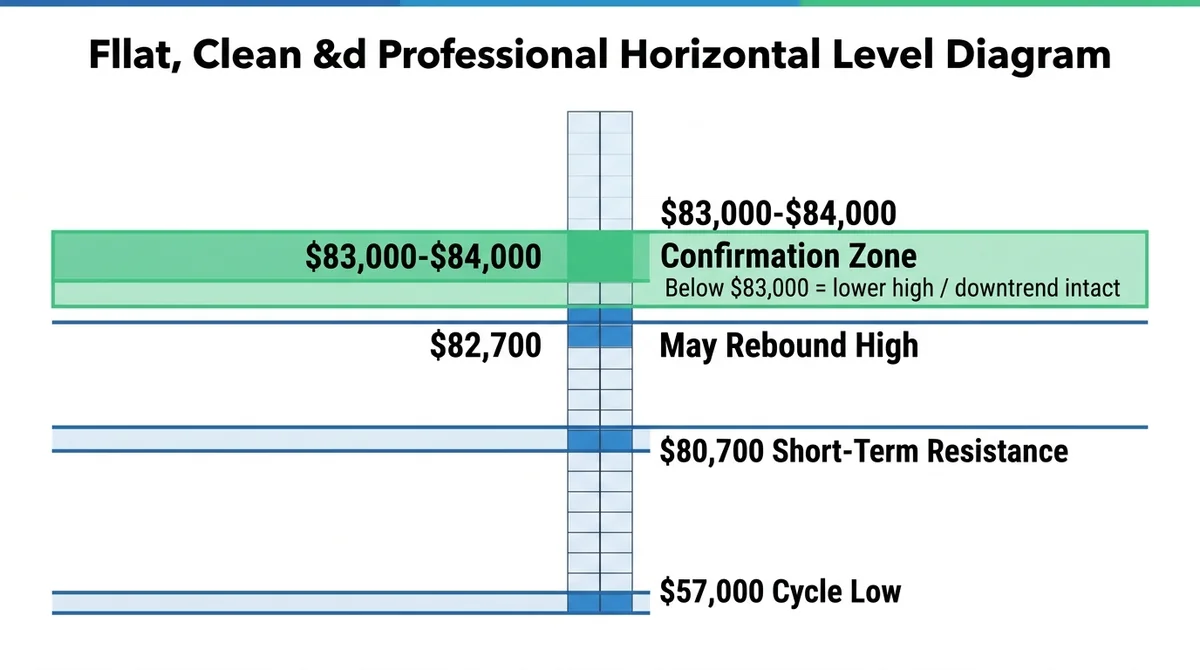
From a moving-average perspective, Bitcoin has now reached resistance near $80,700 and is also close to the 50-week moving average, so encountering a hurdle here is normal. The reason is that the short-term gain has been too large: the daily RSI high is already near 85, clearly in overbought territory.
In this state, the market needs a period of sideways consolidation or a modest pullback to digest the gains. For long-term holders, healthy consolidation is actually beneficial for further upside, building room for the next leg. If price keeps surging without consolidating near $81,000, the eventual pullback will be correspondingly larger. Therefore, a healthy pullback and sideways movement are necessary for the market's long-term health.
3. Comparison With the Previous Bear Market Breakout
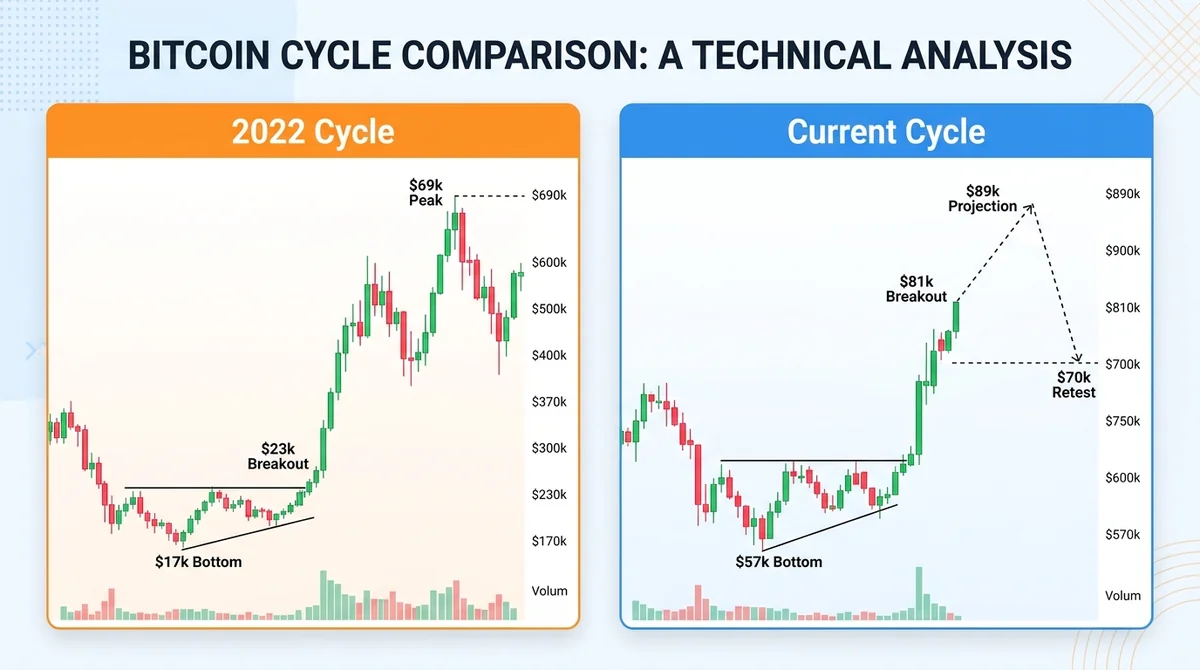
Looking back at the previous bear market, Bitcoin peaked near $69,000 and slid steadily. During that period it briefly broke above the bull market support line and the 200-day moving average several times, but these were all fakeouts and did not form a decisive breakout. The real trend reversal came when price surged directly from around $17,000 to above $23,000, quickly and substantially reclaiming both long-term moving averages, followed by roughly two months of retesting that confirmed support before the previous bull market officially began.
Comparing candlestick patterns, the six-month price action after the previous cycle bottomed in November 2022 is highly similar to the current action since bottoming near $57,000, including the way it bottomed and the timing of the breakout. If this template holds, the current rebound could extend as high as around $89,000, then retest down to around $70,000 before the next bull market officially begins.
It should be noted that this projection rests on the assumption that historical patterns repeat, and is not a certainty.
4. Projecting the Bottom Timing: Why It Could Come Early
The biggest difference from the previous cycle is the timing of the bottom. In past four-year cycles, Bitcoin typically bottomed in the fourth quarter of a midterm election year. But in this cycle, market structure has fundamentally changed: this is Bitcoin's first bear market with spot ETFs, and with spot ETFs for Ethereum as well, with the market essentially institution-led.
When market conditions are completely different from the past, the phenomenon of "front-running" often appears. In the previous cycle, Bitcoin's first all-time high before the halving was an example of front-running. Based on this logic, this cycle's bottom timing may also come early: the highest-probability scenario is a bottom near $57,000 this summer, before the end of August; the second-highest probability is the first quarter of 2027; the lowest probability is the fourth quarter of this year.
5. Key Support Zones on a Pullback
If price pulls back, watch the bull market support line and the 200-day moving average. These two indicators currently sit roughly around $68,000 to $69,000; if a retest occurs in a few weeks to a month or two, the moving averages may have risen to $70,000 or slightly above.
$70,000 is also the peak zone of the previous cycle's bull market (around $69,000), so this level will form strong confluence support. Even if Bitcoin pulls back from above $81,000 to around $70,000, a move of about 15%, that is still positive rather than negative for long-term health and subsequent upside momentum.
6. Supporting Signals: RSI Divergence and Fund Flows
On the technical indicator front, Bitcoin's weekly RSI has formed its first bullish divergence since the previous bear market: price is falling while the weekly RSI is making higher lows. The last similar signal was in the second half of 2022, when price kept falling while the weekly RSI kept rising. A single indicator's signal is of limited significance, but when multiple indicators point to a trend reversal together, the signal's credibility rises significantly.
On the funding side, spot Bitcoin ETFs have seen net inflows for six consecutive trading days, with about $338 million on the most recent day and about $2.26 billion over the six days; last week alone saw about $1.92 billion in inflows, the largest weekly inflow since last October. However, year-to-date the total is still a net outflow of about $2.57 billion. Spot Ethereum ETFs have also seen six consecutive days of inflows totaling about $813 million, but remain at a net outflow of about $1.3 billion year-to-date. The market sentiment index also rebounded quickly from 41 last week to 74, entering greed territory, showing that market mood can shift rapidly in a short time.
7. Conclusion and Watchlist
In sum, all eyes are currently on the $83,000 level. A decisive break above and hold of this zone would confirm that this bear market ended near $57,000; if it fails to break through, the small-probability scenario of a lower low must still be kept in mind.
Three things are worth tracking going forward:
- Whether Bitcoin can decisively break above and hold $83,000;
- How the bull market support line and 200-day moving average (currently around $68,000 to $69,000, possibly rising to near $70,000) hold on a pullback;
- Whether spot ETF flows can shift from net outflows to sustained net inflows.
This analysis is based on historical cycles and technical indicators. Changes in market structure may invalidate historical patterns, so please make independent judgments based on your own risk tolerance.
This article is produced by the MSXGO editorial team, AI-assisted, and reviewed through an editorial process. Fee rates and figures are subject to each platform's latest official announcements.
Finished reading? Ready to try trading?
Tokenized stocks/ETFs, crypto spot, and perpetual futures in one account — perp maker 0.02% / taker 0.045%, RWA spot buy 0.3% / sell 0.
Free sign-up · 3 quick steps