From a $1.28 Trillion Market Cap to $1 Million per Bitcoin: Capital Inflow Model 2026
Bitcoin inflow model using a $63,868 price and $1.28T market cap to assess the $1M target, $20.04T valuation, and $15T estimate.

Article Citation Summary
Bitcoin inflow model using a $63,868 price and $1.28T market cap to assess the $1M target, $20.04T valuation, and $15T estimate.
From a $1.28 Trillion Market Cap to $1 Million per Bitcoin: Capital Inflow Model 2026
Key Takeaways / TL;DR
- As of August 15, 2026, the report used a benchmark Bitcoin price of $63,868 and a benchmark market capitalization of approximately $1.28 trillion.
- A rise from $63,868 to $1 million represents a price multiple of approximately 15.66x. Under a linear relationship, the target market cap would be approximately $20.04 trillion.
- Subtracting the benchmark market cap from the linear target market cap produces a market cap increase of approximately $18.76 trillion, but this figure cannot be treated directly as new capital inflow.
- Markus Thielen estimated that reaching $1 million would require approximately $15 trillion in additional capital inflows, equivalent to 25% of the total U.S. stock market capitalization. This is an opinion-based estimate, not the linear difference in market cap.
- The $1 million figure is used only for scenario testing through 2030. It is not a definitive price target or a promise of returns.
Risk warning: This article only explains the calculation methods used in a public report and does not constitute investment advice. Crypto assets are highly volatile, and you may lose your entire principal. Do your own research and make independent decisions (DYOR).
This Bitcoin capital inflow model addresses three questions: what market cap would correspond to a $1 million Bitcoin price, what the linear increase in market cap would be, and why that increase cannot be equated directly with a researcher's capital inflow estimate. All reported facts come from the same public article, while the calculations clearly identify their formulas, date, and assumptions.
What Data Is Needed Before Modeling a $1 Million Bitcoin Price?
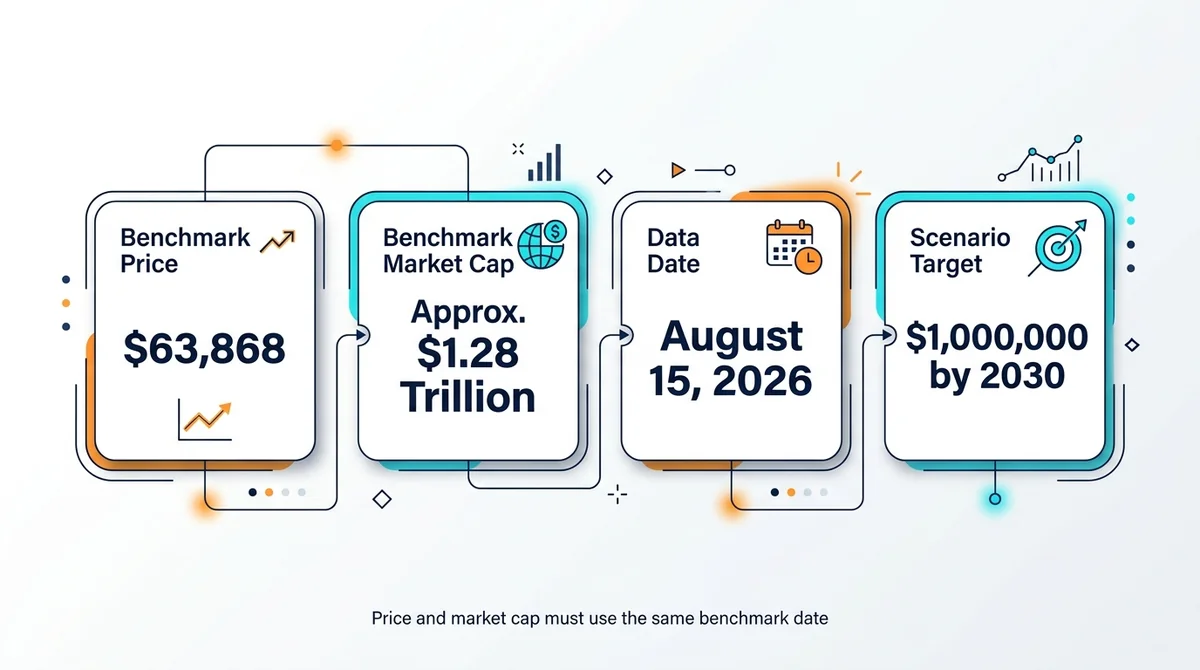
Before performing the calculation, prepare the $63,868 benchmark price, the approximately $1.28 trillion benchmark market cap, the $1 million target price, and the 2030 time horizon. You must also distinguish between an increase in market cap and capital inflow.
According to a Cointelegraph report published on August 15, 2026, Bitcoin was priced at $63,868 at the time, with a market capitalization of approximately $1.28 trillion. This article uses only those reported figures as a consistent starting point and does not mix in prices or market caps from other dates.
As of August 15, 2026, the $1 million Bitcoin scenario uses a price of $63,868 and a market cap of approximately $1.28 trillion as its benchmarks. An increase in market cap is not the same as actual capital inflow.
How Should the Benchmark Price and Market Cap Be Recorded?
Start by creating an input checklist and labeling each figure with its date, unit, and purpose:
- Benchmark price: $63,868, used to calculate the target price multiple.
- Benchmark market cap: Approximately $1.28 trillion, used to derive the implied supply in the model and calculate the target market cap.
- Data date: As of August 15, 2026.
- Target price: $1,000,000 per Bitcoin.
- Scope: Scenario modeling through 2030.
Market capitalization—the total value obtained by multiplying the price per coin by the number of coins in the model—and price must use the same benchmark date. If the price comes from one date and the market cap from another, the implied supply will no longer be based on a consistent dataset.
Why Must Market Cap Growth and Capital Inflow Be Separated?
Market cap growth is the mathematical difference between the target market cap and the benchmark market cap. Capital inflow is an estimate, produced by a model or researcher, of the additional funding required. The $18.76 trillion calculated in this article belongs to the first category, while Thielen's $15 trillion figure belongs to the second. The two are not interchangeable.
Steps One and Two: How to Prepare the Formulas and Choose a Bitcoin Market Cap Calculation Method
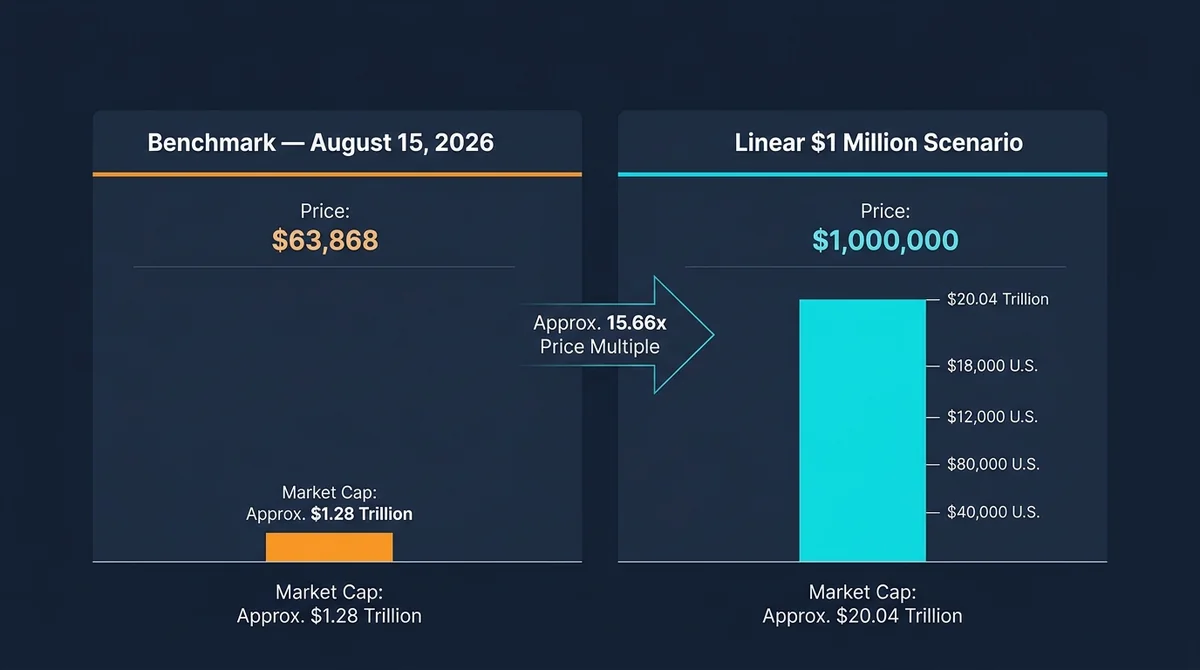
Based on the reported data, the model implies a Bitcoin supply of approximately 20.04 million coins. A rise from $63,868 to $1 million requires a price multiple of approximately 15.66x, after which the two different calculation approaches can be applied.
Dividing approximately $1.28 trillion by $63,868 produces an implied model supply of approximately 20.04 million Bitcoin. Dividing $1 million by $63,868 produces a target price multiple of approximately 15.66x.
Step One: Derive the Implied Number of Bitcoin in the Model
The modeled supply—derived solely to keep the price and market cap inputs consistent—can be calculated with the following formula:
模型数量 = 基准市值 ÷ 基准价格
         = 1.28万亿美元 ÷ 63,868美元
         ≈ 2,004万枚
The approximately 20.04 million coins figure is an estimate derived from the two reported data points. It should not be interpreted as the exact circulating supply on any other date. Because the benchmark market cap is itself approximate, all subsequent results must retain the same rounding convention.
Step Two: Calculate the Target Price Multiple
The price multiple is calculated by dividing the target price by the benchmark price:
目标价格倍数 = 1,000,000美元 ÷ 63,868美元
             ≈ 15.66倍
Under this model, $1 million is approximately 15.66 times the benchmark price. This multiple describes only the ratio between the two prices. It says nothing about the path required to reach that price and does not prove that the target will be achieved by 2030.
For more information about what technical indicators can and cannot show, read the guide to RSI settings and crypto trading signals. Technical indicators organize price information, but they cannot replace capital inflow modeling or prove that a long-term target will be reached.
Why Keep Both Calculation Approaches?
This article presents two approaches side by side:
- Linear market cap method: Assumes that price and market capitalization change in the same proportion. It is used to calculate the theoretical market cap corresponding to a $1 million Bitcoin price.
- Capital inflow estimate: Cites Thielen's estimate of approximately $15 trillion to express his view of the funding required.
The two methods answer different questions. The linear market cap method answers, “What market cap corresponds to a $1 million price?” The capital inflow estimate answers, “How much additional funding does the researcher believe Bitcoin would need to attract?” One figure must not be presented as the result of the other formula.
Steps Three and Four: How to Calculate and Verify the $1 Million Target Market Cap
The Bitcoin capital inflow model shows that, under a linear relationship, a price of $1 million per Bitcoin would correspond to a market cap of approximately $20.04 trillion. That is approximately $18.76 trillion above the $1.28 trillion benchmark, but the difference does not equal actual capital inflow.
Step Three: Calculate the Target Market Cap and Market Cap Increase
The target market cap can be calculated by multiplying the benchmark market cap by the target price multiple:
线性目标市值 = 1.28万亿美元 × 15.66
             ≈ 20.04万亿美元

线性市值增量 = 20.04万亿美元 - 1.28万亿美元
             ≈ 18.76万亿美元
At a Bitcoin price of $1 million, the linear model produces a market cap of approximately $20.04 trillion and a market cap increase of approximately $18.76 trillion. Separately, Thielen estimated that approximately $15 trillion in capital inflows would be required.
Bitcoin $1 Million Scenario Calculation Table as of August 15, 2026
| Calculation item | Input or formula | Result | Meaning |
|---|---|---|---|
| Bitcoin benchmark price as of August 15, 2026 | Reported price | $63,868 | Starting point for calculating the target price multiple |
| Bitcoin benchmark market cap as of August 15, 2026 | Reported market cap | Approximately $1.28 trillion | Starting point for calculating the target market cap |
| Number of Bitcoin in the model | $1.28 trillion ÷ $63,868 | Approximately 20.04 million coins | Approximate supply implied by the benchmark price and market cap |
| $1 million target price multiple | $1,000,000 ÷ $63,868 | Approximately 15.66x | Target price as a multiple of the benchmark price |
| Linear target market cap at $1 million | $1.28 trillion × approximately 15.66 | Approximately $20.04 trillion | Result assuming price and market cap change in the same proportion |
| Linear market cap increase in the $1 million scenario | $20.04 trillion − $1.28 trillion | Approximately $18.76 trillion | Mathematical difference in market cap, not actual capital inflow |
| Thielen's capital inflow estimate | Researcher's assessment cited in the report | Approximately $15 trillion | Estimated capital inflows required over the next four years |
What Does Thielen's $15 Trillion Figure Represent?
The report cited Markus Thielen, head of research at 10x Research, as saying that Bitcoin would need to attract approximately $15 trillion in additional funding to reach $1 million per coin. That would be equivalent to approximately 25% of the total U.S. stock market capitalization flowing into Bitcoin over the next four years. This figure is the researcher's estimate, not a market cap difference calculated by subtraction in this article.
Step Four: Verify the Result With a Reverse Calculation
To verify the calculation, divide the linear target market cap by the modeled Bitcoin supply:
反向价格 = 约20.04万亿美元 ÷ 约2,004万枚
         ≈ 100万美元/枚
The result returns to approximately $1 million, showing that the formulas are internally consistent under the current rounding convention. If the verification result differs materially from the target, check whether dollars and trillions of dollars were mixed, whether the multiple was applied more than once, or whether the modeled supply was derived from data on a different date.
What Are the Most Common Mistakes When Using a Bitcoin Capital Inflow Model?
The most common mistakes are treating a change in market cap as actual capital inflow, confusing the $15 trillion and $18.76 trillion figures, or presenting a person's forecast as an outcome that has already occurred.
Approximately $18.76 trillion is the increase in market cap under the linear model, while approximately $15 trillion is Thielen's capital inflow estimate. The two figures have different definitions, sources, and calculation methods.
Avoid the following errors:
- Describing market cap growth as new funding: Approximately $18.76 trillion is only the mathematical result of subtracting the benchmark market cap from the target market cap.
- Presenting an opinion-based estimate as a formula result: The approximately $15 trillion figure comes from Thielen's assessment. It is not the difference between $1.28 trillion and $20.04 trillion.
- Mixing units: $63,868, $1,000,000, $1.28 trillion, and 15.66x must each retain the correct unit.
- Ignoring approximations: Because the benchmark market cap is approximately $1.28 trillion, the 20.04 million coins, 15.66x multiple, and $20.04 trillion market cap are all approximate results.
- Presenting forecasts as facts: Brian Armstrong, Jack Dorsey, and Cathie Wood have predicted that Bitcoin could reach $1 million by 2030, but a forecast does not mean the outcome has already occurred.
The report also presented an opposing view. Thielen argued that reaching $1 million by 2030 was “mathematically impossible” based on the scale of the required capital inflows. Brian Armstrong, Jack Dorsey, and Cathie Wood, by contrast, have offered $1 million forecasts. These statements represent different opinions about Bitcoin's future price and must not be presented as market outcomes that have already occurred.
What Risk Boundaries Should Be Considered When Using a Bitcoin 2030 Price Model?
A Bitcoin 2030 price model can only describe a scenario based on specified prices, market caps, and linear assumptions. It cannot prove that a target will be reached, guarantee returns, or eliminate investment risk.
Present the Model Result as a Scenario, Not a Price Promise
Appropriate wording should emphasize the conditions: if the modeled Bitcoin supply remains approximately 20.04 million coins and price and market cap change in the same proportion, then a $1 million price would correspond to a market cap of approximately $20.04 trillion. This statement explains the calculation conditions; it does not guarantee Bitcoin's price path through 2030.
When analyzing market conditions, it is also important to distinguish between calculation tools and trading signals. For information about identifying range-bound and trending markets, see the market regime comparison of mean-reversion and breakout strategies. No method can turn a scenario model into a certain forecast.
State the Date, Assumptions, and Rounding Limitations
At a minimum, the model should disclose the following three limitations:
- Data date: As of August 15, 2026.
- Core assumption: Price and market cap change in the same proportion under the linear model.
- Rounding convention: The benchmark market cap, modeled supply, multiple, and target market cap are all presented as approximate figures.
What Does the Sensitivity Analysis Show at Different Target Prices?
Using the same benchmark data and linear assumption, the target price can be changed to see how the theoretical market cap responds:
| Bitcoin target price | Price multiple relative to $63,868 | Linear target market cap | Market cap increase from $1.28 trillion |
|---|---|---|---|
| $100,000 per Bitcoin | Approximately 1.57x | Approximately $2.00 trillion | Approximately $0.72 trillion |
| $500,000 per Bitcoin | Approximately 7.83x | Approximately $10.02 trillion | Approximately $8.74 trillion |
| $1,000,000 per Bitcoin | Approximately 15.66x | Approximately $20.04 trillion | Approximately $18.76 trillion |
Under the same linear assumption, $100,000 corresponds to a market cap of approximately $2.00 trillion, $500,000 corresponds to approximately $10.02 trillion, and $1 million corresponds to approximately $20.04 trillion. If the target price doubles, the theoretical market cap also rises in the same proportion.
These results are arithmetic projections based on the same benchmark data. They are not new reported facts and do not account for market liquidity, trading paths, or investor behavior. Sensitivity analysis only shows how changes in an input affect a linear result; it cannot determine the probability that a target price will be reached.
How Should the $100,000 and $1 Million Scenarios Be Interpreted?
Thielen believes Bitcoin may not set a new high in the following year and that a recovery to $100,000 would already be a major achievement. At the same time, he rejected the highly optimistic scenario of Bitcoin reaching $1 million by 2030. Both figures are scenarios expressed in his opinion, not prices that have already occurred.
Technical analysis also cannot provide definitive proof of a long-term target. A tutorial on identifying RSI overbought and oversold signals may help explain how indicators are interpreted, but indicator signals, individual forecasts, and capital inflow models belong to different analytical categories.
What Other Questions Are Commonly Asked About a $1 Million Bitcoin Price and Capital Inflow Models?
Common questions focus on the $20.04 trillion target market cap, the $15 trillion capital inflow estimate, the people who made the forecasts, and the model's formula, benchmark date, and limitations.
What Market Cap Would Bitcoin Need to Reach $1 Million?
Using the approximately $1.28 trillion benchmark market cap and the 15.66x price multiple as of August 15, 2026, a price of $1 million per Bitcoin would correspond to a linear target market cap of approximately $20.04 trillion. This result assumes that price and market cap change in the same proportion. It is not the amount of actual capital inflow.
Does Bitcoin Really Need Another $15 Trillion?
The approximately $15 trillion figure should not be treated as a universally applicable or definitive funding requirement. It is Thielen's capital inflow estimate cited in the report, not the $18.76 trillion increase in market cap produced by this article's linear model. It also does not mean that the funds have already entered the market.
Who Predicted That Bitcoin Would Reach $1 Million by 2030?
The report named Coinbase CEO Brian Armstrong, former Twitter CEO Jack Dorsey, and ARK Invest CEO Cathie Wood. The list indicates only that they made such forecasts; it does not mean the target will necessarily be reached. Thielen expressed the opposing view in the same report.
Can Technical Analysis Accurately Predict Cryptocurrency Prices?
Technical analysis should not be treated as a deterministic forecasting tool. The source used in this article provides a price, market cap, capital inflow estimate, and individual opinions, but it does not provide data on the accuracy of technical analysis. Therefore, no unverified success rate can be stated, and technical indicators cannot prove a 2030 price target.
Can a Supply-Scarcity Narrative Replace a Capital Inflow Model?
No, not directly. The available source does not provide verifiable supply-scarcity data or related calculations. This article can therefore assess only the price, market cap, and capital inflow measures. It cannot use the available data to infer any additional effect of supply changes on the $1 million target.
Why Doesn't a $18.76 Trillion Increase in Market Cap Equal the Same Amount of Capital Inflow?
The $18.76 trillion figure is only the mathematical difference between the $20.04 trillion target market cap and the $1.28 trillion benchmark market cap. Capital inflow uses a different estimation method. The source does not provide a fixed ratio for directly converting one into the other, so a change in market cap cannot be presented as actual new funding.
What Is the Basic Formula for Bitcoin's Target Market Cap?
The basic formula is “target market cap = benchmark market cap × target price ÷ benchmark price.” Substituting $1.28 trillion, $1 million, and $63,868 produces a result of approximately $20.04 trillion. Because the benchmark market cap is approximate, the final result must also be interpreted as an estimate.
Why Must Price and Market Cap Data Come From the Same Date?
The modeled supply is derived by dividing the benchmark market cap by the benchmark price. If the two inputs come from different dates, price and market cap no longer share a consistent basis. The derived supply and target market cap would then include timing differences and could not be verified consistently.
What Market Cap Does the Linear Model Produce at a Bitcoin Price of $100,000?
Using a price of $63,868 and a market cap of approximately $1.28 trillion as the benchmarks, $100,000 is approximately 1.57 times the benchmark price and corresponds to a linear market cap of approximately $2.00 trillion. This figure is an arithmetic scenario and does not mean Thielen's view will necessarily materialize.
Does a $20.04 Trillion Target Market Cap Prove That Bitcoin Will Reach $1 Million?
No. The $20.04 trillion figure answers only what theoretical market cap would correspond to a $1 million price if the modeled supply remains unchanged and price and market cap move in the same proportion. It provides no probability, timeline, or specific mechanism through which funds would enter the market.
What Does 25% of the Total U.S. Stock Market Capitalization Mean?
The 25% figure in the report illustrates the scale of Thielen's estimated $15 trillion funding requirement. It suggests that an amount equivalent to approximately one-quarter of the total U.S. stock market capitalization would need to flow into Bitcoin over the next four years. This is a comparison used by the researcher to explain the funding threshold, not a capital transfer that has already occurred.
Conclusion
As of August 15, 2026, this Bitcoin capital inflow model starts with a price of $63,868 and a market cap of approximately $1.28 trillion. For Bitcoin to rise to $1 million, its price would need to increase by approximately 15.66x. Under the linear model, that would correspond to a target market cap of approximately $20.04 trillion and a market cap increase of approximately $18.76 trillion.
Thielen's approximately $15 trillion figure is a separate capital inflow estimate, which he said would equal 25% of the total U.S. stock market capitalization. The $18.76 trillion and $15 trillion figures must therefore not be conflated. The $1 million price should also be treated only as a scenario test through 2030, not as a price promise.
The model's limitations are equally clear: the input data comes from the same date, price and market cap are assumed to change linearly, and the calculations use rounded figures. Any conclusion outside those conditions would require additional data. The available source cannot provide a probability of success or any guarantee of returns.
Disclaimer: This article is for informational purposes only and does not constitute investment advice. Crypto assets are highly volatile, and you may lose your entire principal. The calculations depend on public reporting, linear assumptions, and rounded figures. Do your own research and make independent decisions (DYOR).
This article is produced by the MSXGO editorial team, AI-assisted, and reviewed through an editorial process. Fee rates and figures are subject to each platform's latest official announcements.
FAQ
What market cap would Bitcoin need to reach $1 million? ▼
Using the approximately $1.28 trillion benchmark market cap as of August 15, 2026, a price of $1 million per Bitcoin would correspond to a linear target market cap of approximately $20.04 trillion, an increase of approximately $18.76 trillion from the benchmark.
Does Bitcoin really need another $15 trillion? ▼
The $15 trillion figure is Markus Thielen's capital inflow estimate cited in the Cointelegraph report. It is not the result of the linear market cap formula and cannot be used interchangeably with the $18.76 trillion increase in market cap.
Who predicted that Bitcoin would reach $1 million by 2030? ▼
The Cointelegraph report named Brian Armstrong, Jack Dorsey, and Cathie Wood, while Markus Thielen expressed the opposing view. Individual forecasts are opinions and do not mean the target will necessarily be reached.
Can technical analysis accurately predict cryptocurrency price movements? ▼
Technical analysis should not be treated as a deterministic forecasting tool. The source used in this article provides no technical analysis accuracy data or scientifically validated success rate, so no unverified figure can be given.
Why doesn't a $18.76 trillion increase in market cap equal the same amount of capital inflow? ▼
The $18.76 trillion figure is the mathematical difference between the $20.04 trillion target market cap and the $1.28 trillion benchmark market cap. Capital inflow uses a different estimation method, so the two measures have different definitions.
Finished reading? Ready to try trading?
Tokenized stocks/ETFs, crypto spot, and perpetual futures in one account — perp maker 0.02% / taker 0.045%, RWA spot buy 0.3% / sell 0.
Free sign-up · 3 quick steps