Why Bitcoin Is Rising: US Debt Liquidity, ETF Flows, and Market Cycle Logic
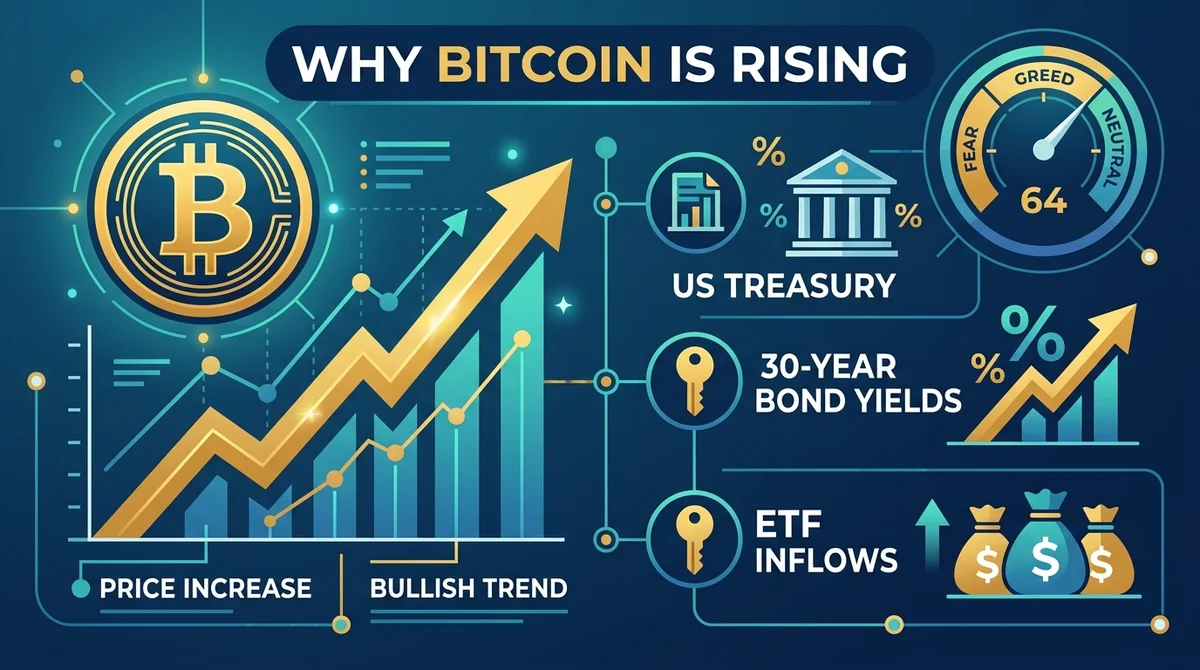
Fear & Greed index, 30-year treasury bonds and Treasury cash, plus Bitcoin and gold ETF flows: the macro logic behind the recent crypto rally.
Article Citation Summary
Fear & Greed index, 30-year treasury bonds and Treasury cash, plus Bitcoin and gold ETF flows: the macro logic behind the recent crypto rally.
Market Overview: From Extreme Fear Back to Greed
Bitcoin recently climbed above $80,000, followed by a weekly rebound of nearly $20,000. At the same time, the top 100 coins rose almost across the board, with some altcoins gaining 44% to 55% in just over two months. Sentiment indicators have shifted from extreme fear two months ago to greed: the Fear & Greed Index reads around 64, while another commonly used sentiment gauge sits near 65.
This rally does not mean the bear market is over, but it does confirm that the past six months were the window when prices sat in extreme fear and aggressive allocation made sense; once an asset has already risen 50% or even doubled, the risk-reward of chasing highs deteriorates noticeably.
Fear & Greed Index: The Cyclical Meaning of Sentiment
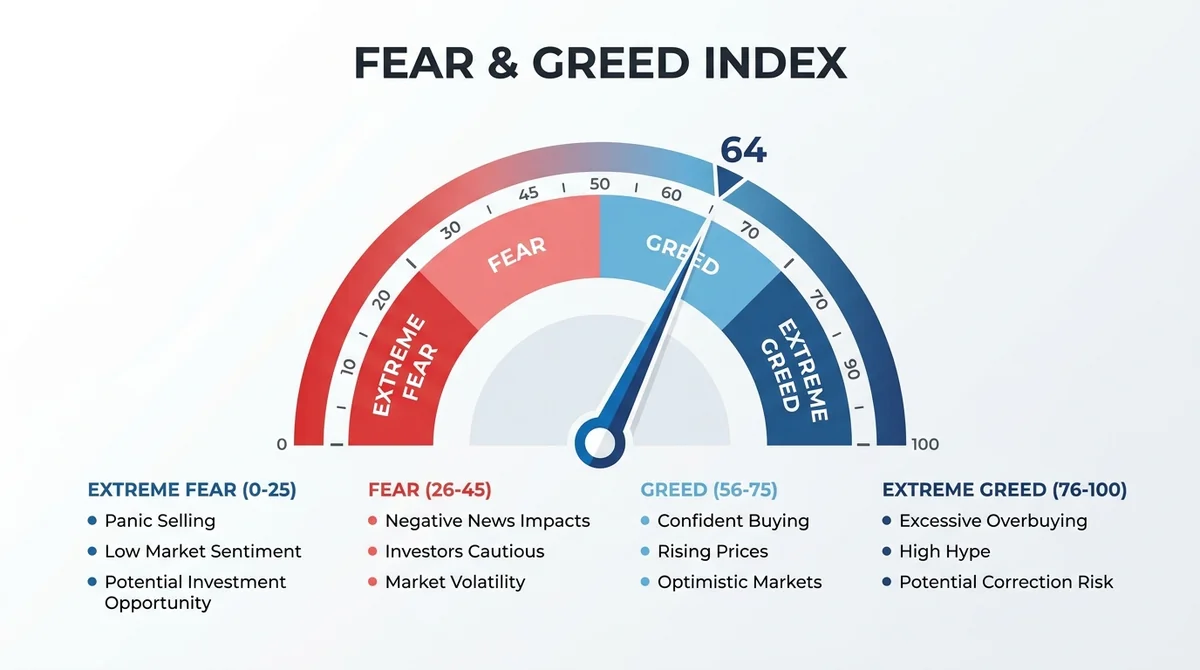
The Fear & Greed Index is a common tool for measuring market sentiment, typically scored from 0 to 100:
- Extreme fear: often corresponds to phases when prices have been oversold, and historically sits closer to medium- to long-term accumulation windows.
- Greed territory: reflects recovering capital sentiment and active buying, but also means short-term value has diminished.
The index currently sits on the greed side, showing the market has healed from its earlier panic. Sentiment indicators are not buy or sell signals in themselves, but they help investors understand where they sit in the cycle and avoid chasing rallies when emotion runs hottest.
30-Year Treasury Bonds and Liquidity: The Macro Driver of the Rally
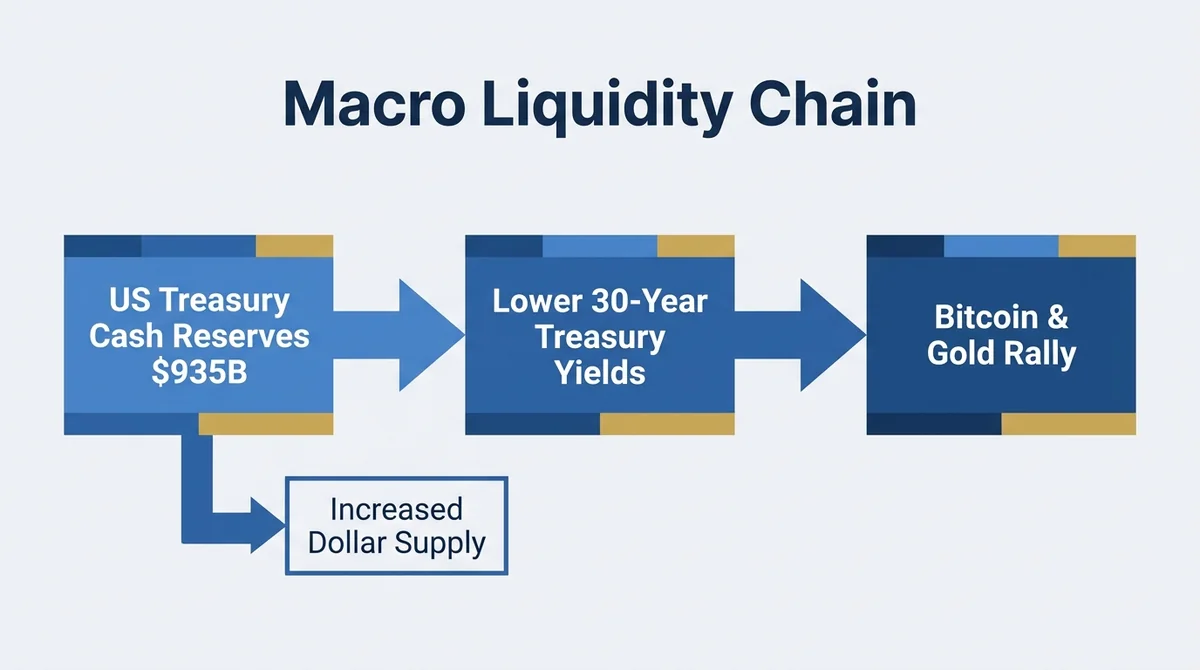
One of the core macro threads behind this rally is the tug-of-war between the US Treasury and 30-year treasury bond yields.
The US Treasury can fund buybacks of treasury bonds by drawing on its cash reserves, with roughly $935 billion available. Treasury Secretary Scott Bessent has made clear he does not want 30-year treasury bond yields to rise, and favors using every necessary tool—including releasing liquidity—to push yields down.
The logic chain can be summarized as:
- The Treasury draws on cash or releases liquidity, pushing long-end yields lower;
- The market expects increased dollar supply and pressure on real interest rates;
- Bitcoin and gold, as inflation-hedge assets sensitive to fiat debasement and debt monetization, react first to this expectation.
Unless geopolitical conflicts (such as the Iran-related situation) ease, or the US sharply cuts fiscal spending, the tools available to suppress long-end yields remain relatively limited under current constraints—an important backdrop for Bitcoin and gold strengthening in tandem.
Bitcoin and Gold ETF Flows: Institutional Capital Returns
ETF flows are a direct gauge of institutional participation.
- On the gold side, gold ETFs (GLD) performed strongly last week, ranking near the top of inflow leaderboards.
- On the Bitcoin side, outflows had persisted for some time, with Bitcoin ETFs left "out in the cold," while October's peak was described by market participants as "the good old days."
- The latest data shows Bitcoin ETFs taking in nearly $2 billion in net inflows in a single week, the largest weekly inflow since October.
One ETF analyst noted that whether buying now or two months ago, holders will likely not regret the purchase over the next two years—this is a personal view, but it reflects institutional capital re-allocating toward the "debasement trade."
Divergence on the Price Path: Possible Downside Risk
Market analysts clearly disagree on the short-term path. One view holds that Bitcoin could still fall back to around its realized price near $52,000. A drawdown of that magnitude could drive many investors out of the market entirely, convinced it is heavily manipulated.
It is worth emphasizing:
- No one can truly predict the price path, including analysts armed with every kind of chart;
- In crypto, observing on at least a two-year cycle is more realistic than chasing short-term swings;
- If prices see an extreme drawdown, it is an opportunity for long-term participants to add exposure—but this is a personal judgment, not any kind of trading advice.
Geopolitics and Sanctions: Demand Outside the Dollar System
Another factor driving Bitcoin and gold comes from the weaponization of sanctions within the dollar system.
The US has warned that any entity doing business with Iran could be cut off from the dollar system. If relevant parties continue buying Iranian oil, the US may sanction major banks, escalating the Iran sanctions issue into a more direct geopolitical confrontation.
The long-term implication of this trend: some countries are reducing their reliance on the dollar standard and turning to reserve assets such as gold. Discussion of continued accumulation of physical gold into reserves has been ongoing for years. Gold is less scarce than Bitcoin, but it still holds a place in portfolios, and this structural demand deserves continued attention.
A Key Signal: This Rally Does Not Depend on a Single Buyer
One notable market signal: a well-known public company (Michael Saylor's Strategy) did not buy any Bitcoin in the past week, nor did it issue any related accumulation announcement.
Even so, Bitcoin still rose nearly $20,000 last week. This shows:
- This rally is unrelated to that company's continued buying;
- Other active buyers exist in the market, with more diversified sources of demand;
- The earlier worry that "Bitcoin would crash without this company propping it up" has been disproven.
Two months ago that company engaged in selling, which briefly confused the market and triggered a decline. The current rebound, driven by a broader set of market participants, is a healthier signal for market structure.
Information Environment: Beware of Misleading Views
On social media and video platforms, some influential accounts kept recommending shorting during Bitcoin's decline, even staying bearish toward $40,000 near $58,000; after prices rebounded, they claimed they had always recommended going long. Such contradictory and even misleading statements are not uncommon in the market.
For investors, useful practices include:
- Filter information sources, prioritizing content that is logically consistent and verifiable;
- Be wary of content that manufactures FOMO or panic;
- When an account contradicts itself or tries to make its audience doubt their own judgment, unfollow promptly;
- Build your own analytical framework rather than relying on a single opinion leader.
Summary
The current crypto rally is supported by three threads: liquidity expectations released at the fiscal and monetary level, returning flows into Bitcoin and gold ETFs, and structural reserve demand outside the dollar system. Sentiment indicators have shifted from extreme fear to greed, reducing short-term value, but from a medium- to long-term cycle perspective, the market's demand structure is becoming more diversified and healthier. Investors should make independent judgments based on their own risk tolerance.
This article is produced by the MSXGO editorial team, AI-assisted, and reviewed through an editorial process. Fee rates and figures are subject to each platform's latest official announcements.
Finished reading? Ready to try trading?
Tokenized stocks/ETFs, crypto spot, and perpetual futures in one account — perp maker 0.02% / taker 0.045%, RWA spot buy 0.3% / sell 0.
Free sign-up · 3 quick steps