Crypto Exchange Comparison Methodology 2026: How to Evaluate Platforms Across Fee Structure, Liquidity Depth, and Regulatory Compliance
How to choose the best crypto exchange in 2026? Evaluate fee structure, liquidity depth, and compliance with our 3-dimension framework and 4-step selection process.
Article Citation Summary
How to choose the best crypto exchange in 2026? Evaluate fee structure, liquidity depth, and compliance with our 3-dimension framework and 4-step selection process.
Crypto Exchange Comparison Methodology 2026: How to Evaluate Platforms Across Fee Structure, Liquidity Depth, and Regulatory Compliance
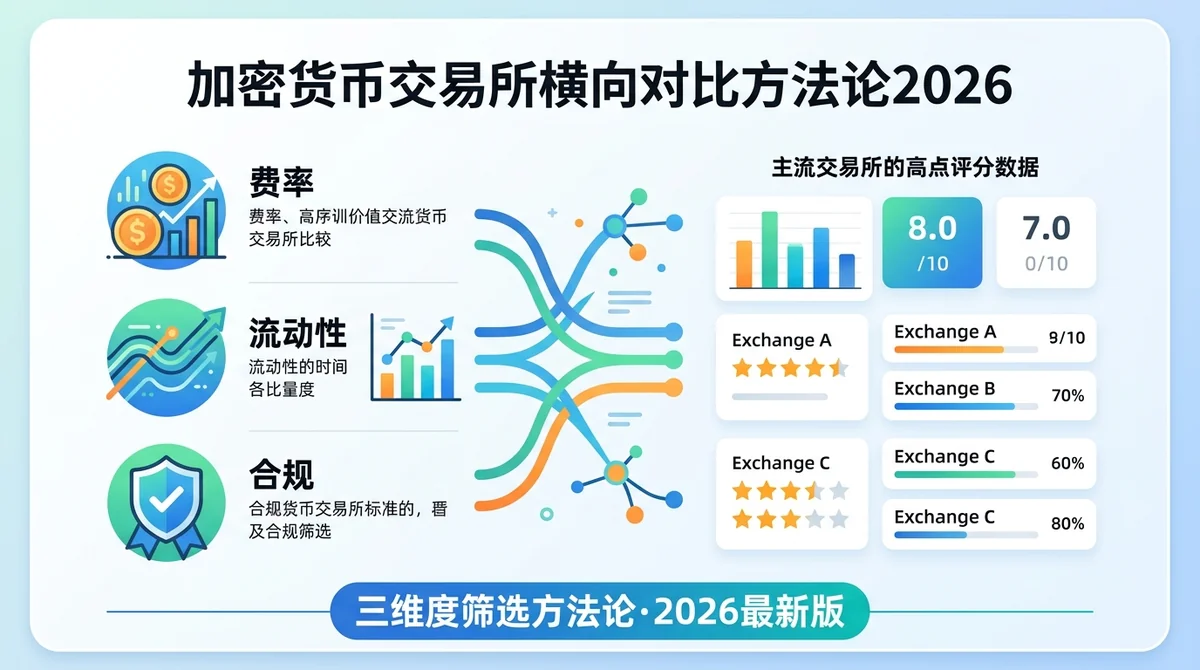
Most people pick an exchange based on a single factor — either fees alone or licensing alone — and end up making a poor choice. By 2026, the differences between major platforms have become nuanced enough that single-dimension evaluation consistently leads to misjudgment. This article offers a practical three-dimension evaluation framework — fee structure, liquidity depth, and regulatory compliance — to help different types of users find the platform that genuinely fits their needs.
Quick Comparison Table: Three-Dimension Scores for Major Exchanges
Before diving into each dimension, here is a summary view for quick reference. All scores below are based on publicly verifiable platform data, rated out of 10.
Fee Structure Score Comparison
| Platform | Spot Maker | Spot Taker | Futures Maker | Futures Taker | Token Discount | Fee Score |
|---|---|---|---|---|---|---|
| MSX | 0.080% | 0.100% | 0.020% | 0.050% | Yes (MSX Token) | 9.0 |
| Binance | 0.100% | 0.100% | 0.020% | 0.050% | Yes (BNB) | 8.5 |
| OKX | 0.080% | 0.100% | 0.020% | 0.050% | Yes (OKB) | 8.5 |
| Bybit | 0.100% | 0.100% | 0.020% | 0.055% | Partial | 8.0 |
Note: Rates above reflect each platform's standard fee tier (VIP 0) as of 2026. Higher VIP levels unlock further discounts.
Liquidity Depth Score Comparison
| Platform | BTC/USDT Avg Daily Volume | Major Trading Pairs | Order Book Depth (±2%) | Liquidity Score |
|---|---|---|---|---|
| Binance | Tier 1 | 350+ | Very Deep | 9.5 |
| OKX | Tier 2 | 200+ | Deep | 8.5 |
| Bybit | Tier 2 | 150+ | Deep | 8.0 |
| MSX | Growing | 100+ | Moderate | 7.5 |
Regulatory Compliance Score Comparison
| Platform | Key Licensed Jurisdictions | Proof of Reserves | User Insurance Fund | Compliance Score |
|---|---|---|---|---|
| Coinbase | US (CFTC/SEC registered) | Yes | Yes (FDIC insurance) | 9.5 |
| Binance | MAS (Singapore), multi-jurisdiction | Yes | Yes (SAFU Fund) | 8.0 |
| OKX | MAS, multi-jurisdiction | Yes | Yes | 8.0 |
| MSX | Compliance in progress | Yes | Yes | 7.5 |
Compliance scores vary significantly by jurisdiction. Always verify whether a platform holds a valid license in your specific region rather than relying on the overall score.
For a more comprehensive breakdown of fee details across platforms, see Crypto Exchange In-Depth Comparison 2026: Full Feature Review of Spot, Futures, and Leverage Products.
Dimension 1: Fee Structure — What Your Trades Actually Cost
Fees look simple on the surface, but the "real cost" of trading is often far more complex than the standard rate suggests. A trader who ignores hidden costs may end up paying more on a platform that advertises lower fees.
The Core Difference Between Maker and Taker Fees
Makers are order placers — you submit a limit order that doesn't fill immediately and sits in the order book waiting. Because you're providing liquidity to the market, the platform charges a lower maker fee, and some platforms even offer negative rates (rebates).
Takers are order fillers — you submit a market order or a limit order that executes immediately, consuming liquidity from the order book, so you pay a higher taker fee. For traders who frequently use market orders, the taker fee is the more critical cost variable.
To put it in concrete terms: a market buy order of 10,000 USDT at a taker fee of 0.10% costs 10 USDT in fees. The same 10,000 USDT placed as a limit order (maker) costs only 8 USDT. Over time, that difference adds up.
How VIP Tiers and Platform Token Discounts Affect Fees
Major exchanges universally apply a tiered fee structure where higher monthly trading volume unlocks lower rates. Using futures trading as an example:
| VIP Level | Monthly Futures Volume Required | Maker Fee | Taker Fee |
|---|---|---|---|
| VIP 0 | < 5M USDT | 0.020% | 0.050% |
| VIP 1 | ≥ 5M USDT | 0.016% | 0.040% |
| VIP 2 | ≥ 20M USDT | 0.012% | 0.035% |
| VIP 3 | ≥ 100M USDT | 0.010% | 0.025% |
Beyond trading volume, holding platform tokens typically unlocks additional discounts. MSX Token holders, for example, can stack an extra 25% fee discount. For traders with monthly volumes in the millions of USDT, platform token discounts can be substantial — worth factoring into your platform decision.
Hidden Costs: Funding Rates, Withdrawal Fees, and Slippage
Beyond the visible maker/taker fees, three categories of hidden costs deserve equal attention:
Funding Rate: Applies to perpetual futures, settled every 8 hours. When the market is heavily skewed long, longs pay shorts; in a bearish market, the reverse applies. In trending markets, cumulative funding rate costs can exceed the trading fees themselves.
Withdrawal Fees: Platforms charge different withdrawal fees depending on the network. Withdrawing USDT via TRC-20 is typically several times cheaper than via ERC-20. Traders who move funds frequently should verify each platform's withdrawal fee structure.
Slippage: Technically a liquidity issue, but it shows up directly as a trading cost. A market order on a thinly traded pair can execute at a price 0.5%–2% worse than expected — far exceeding the nominal fee.
For a detailed spot fee comparison across platforms, see Binance Spot Maker and Taker Fee Structure Explained 2026: Official Rates Deep Dive.
Citable Summary: In 2026, the standard futures maker fee across major exchanges is typically around 0.02%, with taker fees around 0.05%. With platform token discounts applied, taker fees can drop to the 0.03%–0.04% range. Real trading costs must also account for funding rates (settled every 8 hours), withdrawal fees, and slippage — bringing the true all-in cost 20%–50% above the headline rate.
Dimension 2: Liquidity Depth — Will Your Order Fill at the Expected Price?
Liquidity is the dimension most traders underestimate when choosing a platform. A platform with low fees but poor liquidity can cost you far more in slippage than a higher-fee platform with deep order books.
The Relationship Between Bid-Ask Spread and Order Book Depth
The bid-ask spread is the gap between the best bid and best ask in the order book, and it directly reflects immediate market liquidity. For major pairs like BTC/USDT, top-tier platforms typically maintain spreads of 0.01%–0.05%. On platforms with weaker liquidity, the same pair can show spreads of 0.1%–0.3%.
Order book depth measures the total volume available to trade within a given price range. The standard metric is "±2% depth": the total order volume sitting within 2% above and below the current mid-price. Greater depth means the platform can absorb larger orders with less price impact.
For retail traders with daily volumes under 10,000 USDT, liquidity differences between major platforms are barely noticeable. But for single orders exceeding 100,000 USDT, choosing the wrong platform can directly cause 0.5%–1% in additional slippage.
How to Assess Slippage Risk for Large Orders
Two practical methods for evaluating slippage before placing a large order:
Method 1: Read the order book. Open the order book for your target pair, cumulate the available volume from the best price outward until the total matches your order size, and observe how far the price drifts.
Method 2: Use simulated order tools. Some platforms let you enter an order size and see the estimated average fill price in real time. This is the most direct way to assess expected slippage.
A practical example: buying 500,000 USDT worth of BTC on a platform where the order book only has 300,000 USDT of depth within ±0.5% of the current price. The remaining 200,000 USDT will fill at worse prices, and the blended slippage could reach 0.3%–0.8% — a hidden loss of 1,500–4,000 USDT.
Liquidity Stratification: Majors vs. Mid-Caps vs. Low-Cap Tokens
Liquidity varies dramatically across trading pairs and needs to be assessed by tier:
- Tier 1 (BTC, ETH major pairs): Deep on top-tier platforms, with negligible slippage. Mid-sized platforms perform reasonably close to top platforms here.
- Tier 2 (mid-cap altcoins, e.g., SOL, BNB): Platform differences start to matter. Second-tier platforms may offer only 30%–50% of a top platform's depth.
- Tier 3 (small-cap new tokens): Liquidity is highly fragmented. Spreads for the same token can differ by 3%–10% across platforms, and some tokens are effectively illiquid on certain exchanges.
If you primarily trade major tokens, liquidity differences across platforms will have limited impact on you. But if you trade altcoins or newly listed tokens, order book depth should be a top priority.
Citable Summary: Key metrics for evaluating exchange liquidity are order book ±2% depth and real-world slippage tests. In 2026, top-tier platforms' BTC/USDT ±2% depth dwarfs that of mid-sized platforms by 3–5x. For single orders above 100,000 USDT, the slippage cost from choosing a less liquid platform typically exceeds any fee savings — making it an unavoidable hidden cost in platform selection.
Dimension 3: Regulatory Compliance — Institutional Safeguards for Platform Safety
Compliance is the dimension retail traders most often overlook — and the one with the highest cost when it goes wrong. Most major exchange collapses in history (such as FTX) ultimately came down to the absence of regulatory oversight.
Major License Types and Issuing Authorities
Regulatory licenses differ significantly in meaning and rigor across jurisdictions:
| License / Registration Type | Issuing Authority | Key Requirements | Relevant Users |
|---|---|---|---|
| MSB (Money Services Business) | US FinCEN | AML compliance | US users (baseline) |
| CFTC Registration | US Commodity Futures Trading Commission | Derivatives trading compliance | US futures traders |
| FCA Authorization | UK Financial Conduct Authority | Strict consumer protection | UK and European users |
| MAS License | Monetary Authority of Singapore | Comprehensive crypto asset regulation | Singapore and SEA users |
| VASP License | Hong Kong SFC | HK virtual asset service provider | Hong Kong users |
| ADGM/VARA License | UAE regulatory authorities | Middle East compliance | Middle East users |
Important caveat: a platform may hold licenses in multiple jurisdictions, but those licenses may not cover your country or region. When verifying licenses, confirm that the specific license is valid for users in your location — not just that the platform claims to be "licensed in X."
For compliance guidance for Hong Kong users, see Hong Kong Crypto Trading Compliance Guide 2026: Licensed Exchanges, Tax Reporting, and Futures Regulations. Singapore users can refer to Singapore Regulated Perpetual Futures Exchange Comparison 2026: Licensed Platform Fees, Security, and Regulatory Overview.
User Asset Protection: Proof of Reserves and Cold/Hot Wallet Ratios
Proof of Reserves is the mechanism exchanges use to demonstrate that their user asset holdings match their liabilities, typically implemented via Merkle Tree verification. Users can verify their own account data is included in the proof.
Verification steps:
- Download the proof of reserves file published by the platform
- Obtain your account balance snapshot (usually provided by the platform)
- Use an open-source tool to verify your account data is included in the Merkle Tree
- Confirm on-chain that the declared reserve addresses hold the stated balances
Cold/hot wallet ratio is another critical security indicator. Hot wallets (online) enable fast withdrawals but are vulnerable to hacks; cold wallets (offline) are far more secure. Industry best practice is to hold 90%–95% of user assets in cold storage, with only a small hot wallet balance for daily withdrawal needs. Reputable platforms publish their cold/hot wallet addresses and ratios regularly.
Historical Security Incidents and Platform Response Records
Reviewing a platform's security track record is the most direct way to assess its risk management capabilities:
- Has it been hacked? A hack alone doesn't disqualify a platform, but the response matters — were users fully compensated for losses?
- Does it maintain a user insurance fund? Some platforms hold dedicated funds (such as Binance's SAFU fund) to cover user losses in extreme scenarios.
- Does it proactively publish verifiable information? Compliant platforms publish audit reports and license documents rather than relying solely on verbal claims.
For compliance-related questions, you can reach MSX support via the MSX official website live chat or Telegram official support.
Citable Summary: Evaluating exchange compliance in 2026 requires checking three layers: first, whether the platform holds a valid license in your jurisdiction (FCA/MAS/CFTC/SFC, etc.); second, whether it regularly publishes independently verifiable proof of reserves (Merkle Tree verification); third, whether it fully compensated users and published incident reports following past security events. Platforms that satisfy all three belong in the top compliance tier.
Three-Dimension综合 Evaluation: Optimal Choices for Different User Scenarios
The weighting of each dimension is not fixed — it should shift dynamically based on your trading context. Here are decision paths for three typical user profiles.
High-Frequency Traders: Fee-First Selection Path
High-frequency traders (10+ trades per day, or monthly volumes exceeding 1M USDT) are extremely fee-sensitive. A 0.01% fee difference translates to 1,000 USDT in extra monthly costs at 10M USDT monthly volume.
Decision logic for high-frequency traders:
- Fee dimension weight: 60%
- Liquidity dimension weight: 30% (insufficient liquidity creates slippage that offsets fee savings)
- Compliance dimension weight: 10% (basic compliance is sufficient; the strictest oversight tier is not required)
Recommendation: prioritize platforms with futures maker fees below 0.02%, platform token discounts, and sufficient order book depth on your target pairs. Perpetual Futures vs. Spot Trading: Fees, Leverage Risk, and Return Potential — Complete 2026 Guide includes detailed fee cost calculation methods worth referencing.
Large-Scale Spot Investors: Liquidity-First Selection Path
For spot investors with single trade sizes above 100,000 USDT, the biggest risk isn't fees — it's slippage. On a platform with insufficient liquidity, a large buy order can push the price up against itself, creating adverse price impact.
Decision logic for large-scale spot investors:
- Liquidity dimension weight: 50%
- Compliance dimension weight: 35% (larger assets mean asset security takes priority)
- Fee dimension weight: 15% (absolute fee amounts are high, but still secondary to slippage losses)
Recommendation: choose a top-tier liquidity platform, run a simulated order test to assess expected slippage before committing, and confirm actual fill costs before executing.
Compliance-Sensitive Users: Regulatory-First Selection Path
Certain user groups have rigid compliance requirements — including institutional investors, users in regulated jurisdictions (such as the US or Hong Kong), and users with tax reporting obligations.
Decision logic for compliance-sensitive users:
- Compliance dimension weight: 55%
- Liquidity dimension weight: 30%
- Fee dimension weight: 15%
Recommendation: prioritize platforms with explicit licenses in your jurisdiction, and confirm the platform can export transaction records in a format that meets your tax reporting requirements. Never choose an unlicensed platform just because of lower fees — the legal risk far outweighs any fee savings.
2026 Exchange Selection: A Four-Step Practical Process
With the framework established, here is a concrete four-step screening process you can apply directly.
Step 1: Define Your Trading Needs and Risk Tolerance
Before comparing platforms, answer a few foundational questions:
- What are your primary trading instruments? (BTC/ETH majors vs. altcoins vs. derivatives)
- What is your approximate daily/monthly trading volume?
- What compliance requirements apply to your jurisdiction?
- Do you need leveraged products? (futures/perpetual contracts)
- What is the maximum single-trade loss you can accept?
Clarifying these points lets you determine the right dimension weights and avoid evaluating platforms by the wrong criteria.
Step 2: Verify Regulatory Credentials for Target Platforms
This is the easiest step — and the one most people skip. How to do it:
- Visit the official websites of relevant regulators (FinCEN, FCA, MAS, SFC, etc.) and search for the platform directly to confirm license authenticity
- Review the license scope — confirm it covers your jurisdiction and the product types you want (spot/futures)
- Search the platform name plus terms like "regulatory action" or "enforcement record" to review its compliance history
- Confirm whether the platform regularly publishes proof of reserves
Important: A platform claiming to be "regulated by X" on its website is not sufficient — you must independently verify through the regulator's own database.
Step 3: Test Liquidity and Slippage with Simulated Orders
This step requires logging into the target platform:
- Open your most commonly traded pair (e.g., BTC/USDT) and check the bid-ask spread in the order book
- Enter your typical single trade size and view the platform's "estimated fill price," or manually calculate from order book depth
- Run the test at different sessions (Asia open, European session, US session) — liquidity can vary by 30%–50% across sessions
- Record and compare results across 3–5 candidate platforms
If the platform doesn't offer a simulated order tool, read the top 5 bids and asks directly from the order book and manually estimate slippage.
Step 4: Calculate Your True All-In Fee Cost
Fee comparisons need to be made on a consistent basis. Use the following formula to calculate monthly all-in costs:
Monthly All-In Cost = Trading Fees + Funding Rate Costs + Slippage Costs + Withdrawal Fees
Using futures trading as an example, assuming monthly volume of 1M USDT, an average open position of 300,000 USDT (30% of volume), and a daily funding rate of approximately 0.01%:
| Cost Item | Calculation | Monthly Amount |
|---|---|---|
| Trading Fees (Taker 0.05%) | 1M × 0.05% | 500 USDT |
| Funding Rate (0.01%/day) | 300K × 0.01% × 30 days | 90 USDT |
| Slippage (0.03%/trade × 10 trades) | 100K × 0.03% × 10 | 30 USDT |
| Monthly Total | — | 620 USDT |
In the same scenario, switching to maker limit orders (fee rate 0.02%) brings trading fees down to 200 USDT and monthly total cost to approximately 320 USDT — saving around 300 USDT.
For users looking to further reduce trading costs, see Binance Fees Too High? 2026 Full Comparison of Low-Fee Exchange Alternatives.
FAQ
Q1: How can I quickly determine whether an exchange is properly regulated?
The most direct method is to search the platform name in the licensed entity database on the relevant regulator's official website (e.g., MAS, FCA, SFC). Self-declarations on the platform's own website don't count — you must independently verify through the regulator's database. Also check whether the platform regularly publishes third-party audited proof of reserves. Only when both can be confirmed does the platform clear the basic compliance bar.
Q2: Are lower exchange fees always better?
Not necessarily. A platform with low fees but poor liquidity may cost you more in slippage than you save on fees. More importantly, some low-fee platforms offset their revenue through wider bid-ask spreads or high withdrawal fees, meaning the all-in cost may not actually be lower. True cost assessment requires factoring in trading fees, funding rates, slippage, and withdrawal fees together.
Q3: What is Proof of Reserves, and how do I verify it?
Proof of Reserves is the mechanism exchanges use to demonstrate their user asset holdings match liabilities, typically via Merkle Tree verification. To verify: download the proof file published by the platform, obtain your account balance snapshot, use the platform-provided or an open-source tool to confirm your account data is included in the Merkle Tree, then verify on-chain that the stated reserve addresses hold the declared balances.
Q4: What type of platform is best suited for high-frequency trading?
High-frequency traders should prioritize futures maker fees and the VIP fee reduction pathway. Platforms with futures maker fees below 0.02%, platform token discounts (such as MSX Token), and sufficient order book depth on target pairs typically offer the lowest all-in costs. Also confirm API stability — high-frequency strategies are highly sensitive to interface latency.
Q5: For retail users (monthly volume under 100,000 USDT), which dimension should matter most?
For small retail traders, regulatory compliance is the top priority — keeping funds safe matters far more than saving a few dollars per trade on fees.
FAQ
How do you determine the true trading cost of a crypto exchange? ▼
True trading cost goes well beyond the standard fee rate. You need to factor in funding rates, withdrawal fees, and slippage. In 2026, the standard futures taker fee on major platforms is around 0.05%, but when you add perpetual contract funding rates (settled every 8 hours), network-specific withdrawal fees (TRC-20 is typically several times cheaper than ERC-20), and market order slippage, the real all-in cost is often 20%–50% higher than the headline rate.
What is the difference between maker and taker fees, and which one affects me more? ▼
Makers are order placers who provide liquidity to the market and pay a lower fee; takers are order fillers (market orders) who consume liquidity and pay a higher fee. On a 10,000 USDT order, a taker fee of 0.10% costs 10 USDT, while a maker limit order costs only 8 USDT. Traders who frequently use market orders should pay close attention to the taker rate, as the difference accumulates significantly over time.
How do you assess whether an exchange has sufficient liquidity? ▼
The key metrics are order book ±2% depth and real-world slippage testing. In 2026, top-tier platforms' BTC/USDT ±2% depth far exceeds that of mid-sized platforms — by as much as 3–5x. For retail traders with daily volumes under 10,000 USDT the impact is minimal, but for single orders above 100,000 USDT, slippage from insufficient liquidity (potentially 0.5%–1%) often exceeds the fee differential itself, making the wrong platform choice a costly mistake.
What are the key things to look for when checking an exchange's regulatory licenses? ▼
The critical point is that a license must be valid for users in your specific jurisdiction — not just that the platform is 'licensed somewhere.' Major licenses in 2026 include the US CFTC, UK FCA, Singapore MAS, and Hong Kong SFC's VASP license, with significantly different standards across regulators. A single platform may hold licenses in multiple countries, but coverage doesn't necessarily extend to your region — always verify independently for each jurisdiction.
What is Proof of Reserves, and how can users verify it themselves? ▼
Proof of Reserves is the mechanism an exchange uses to demonstrate that its user asset holdings match its liabilities, typically implemented via Merkle Tree verification. Users can download the platform's published proof file, obtain their account balance snapshot, use an open-source tool to confirm their data is included in the Merkle Tree, and verify on-chain that the declared reserve addresses hold the stated balances — the entire process can be completed independently.
How should different types of users allocate weights across the three evaluation dimensions? ▼
The weights across the three dimensions should be adjusted dynamically based on your trading context, not fixed. High-frequency traders should weight fees most heavily (around 60%) while also considering liquidity (around 30%). Large-order traders should prioritize liquidity depth to avoid slippage canceling out fee advantages. Users with high asset security requirements should significantly increase the weight on regulatory compliance. The article recommends evaluating compliance across three indicators: license validity, proof of reserves, and the platform's track record in handling past security incidents.