MSX Daily US Stock Watch: Dick's Sporting Goods and Treasury Yields: Dick's Earnings Miss Sends Stock Plunging 30%; 30-Year and 2-Year Treasury Yields at 5.15% and 4.18%
Dick's drops 30% on earnings miss; 30Y/2Y yields 5.15% & 4.18% steep curve weighs on risk assets. Nvidia 5.9% implied move, calls dominate; PCE 3.6%.
Article Citation Summary
Dick's drops 30% on earnings miss; 30Y/2Y yields 5.15% & 4.18% steep curve weighs on risk assets. Nvidia 5.9% implied move, calls dominate; PCE 3.6%.
MSX Daily US Stock Watch: Dick's Sporting Goods and Treasury Yields: Dick's Earnings Miss Sends Stock Plunging 30%; 30-Year and 2-Year Treasury Yields at 5.15% and 4.18%
MSX Research Institute
Guest Columnist
@MSX_CN
August 26, 2026
This article is about 5,000 words; full read takes about 8 minutes
Against the backdrop of elevated Treasury yields and cross-verification during earnings season, the single-day 30% plunge in Dick's Sporting Goods may not be an isolated event, but rather one extreme pricing example of earnings blemishes in consumer discretionary under a high discount-rate environment.
AI Summary
Key Takeaway: Dick's Sporting Goods' plunge and elevated Treasury yields together indicate that U.S. stocks currently face dual pressures from high risk-free rates and sticky inflation; earnings blemishes may be punished by sharper valuation compression, and Nvidia's earnings and PCE data will become key verification points for near-term direction.
Key Elements:
- Dick's Sporting Goods plunged 30% on Tuesday after missing earnings expectations and reporting weak footwear business; its dividend yield now stands at 4%.
- As of Tuesday, the 30-year Treasury yield was 5.15%, the 10-year 4.62%, the 2-year 4.18%, and the 3-month 3.79%.
- Nvidia will report earnings after the close on Wednesday; options market data through the weekend showed an implied move of 5.9%, with call volume exceeding put volume.
- Economists expect U.S. July personal income to rise 0.2%, consumer spending to rise 0.1%, and the PCE price index to increase 0.1% month-over-month and 3.6% year-over-year.
1. Dick's Sporting Goods Plunges 30%: Weak Footwear and Earnings Miss Trigger Consumer Sector Valuation Reset
1. Earnings Disaster Sends Shares Down 30% in a Single Day; 4% Dividend Yield Reflects Market Repricing of Dividend Safety Margin
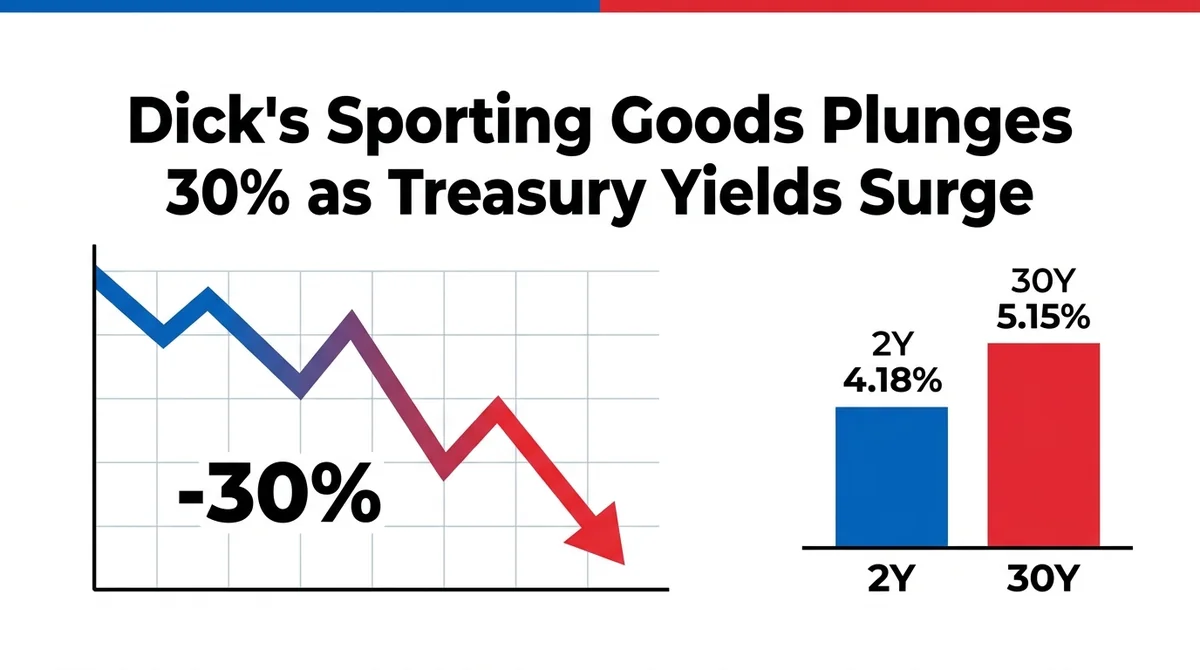
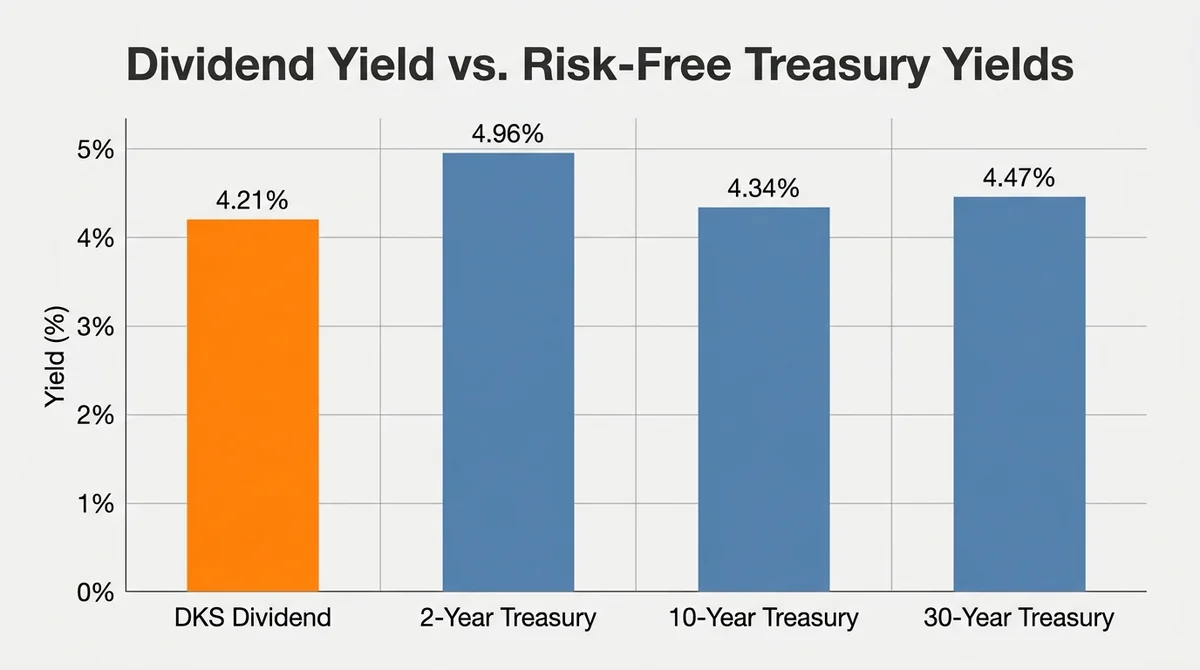
According to CNBC reporting on Tuesday, Dick's Sporting Goods saw its stock plunge 30% after missing earnings expectations and reporting weak footwear business, with its dividend yield now at 4%. A single-day 30% drop is rare among large-cap consumer stocks, likely reflecting not only company-specific earnings blemishes but also an extreme reaction to valuation imperfections in the current high risk-free rate environment. Earnings disasters often trigger rapid rebalancing of institutional positions, and the 30% drop suggests a sharp downward revision in expected future cash flows. Notably, the dividend yield was passively pushed up to 4% after the crash—a level that might traditionally be viewed as a stronger dividend safety margin. However, in a high-rate environment, a 4% dividend yield has little appeal compared with a risk-free yield above 5%, and may instead be interpreted as a passive result of the sharp share-price correction rather than an active value signal. The market's repricing of dividends likely reflects investors' higher demands for dividend coverage and sustainability when financing costs are elevated. For more methods on analyzing individual U.S. stock earnings, see U.S. stock earnings analysis.
Key data: Dick's Sporting Goods plunged 30% in a single day, and its dividend yield passively rose to 4%. Under high risk-free rates, earnings blemishes trigger extreme valuation compression pricing.
Looking further, Dick's Sporting Goods' plunge may not be an isolated event. Against the backdrop of elevated Treasury yields, any earnings miss may be magnified into a re-examination of the sector's valuation logic. This is especially true for consumer discretionary: when risk-free returns can exceed 5%, equity assets must offer higher risk compensation, and earnings blemishes mean the risk premium may need to widen further. The Dick's case shows that until interest-rate pressure subsides, consumer stocks may continue to face dual pressures on earnings and valuation, and the market's tolerance for individual earnings misses is significantly compressed.
2. Weak Footwear Business Is a Fundamental Headwind; Dick's Case Highlights Inventory-Demand Mismatch Risk in Consumer Discretionary
One of the core reasons for Dick's disappointing earnings was weak footwear business. Footwear, as a high-frequency category within consumer discretionary, directly reflects consumer purchasing power and willingness to spend. Against a macro backdrop of sticky inflation and slowing real income growth, consumers may shift spending toward necessities or reduce discretionary consumption, leading to footwear inventory buildup and rising discount pressure. Dick's earnings may have exposed this problem: weakness in footwear could signal that earlier restocking exceeded actual demand, triggering destocking pressure. This case suggests that consumer discretionary stocks are prone to sudden earnings declines during periods of demand-inventory mismatch.
For the market, Dick's plunge may be a microcosm showing that, with macro rates elevated and consumer momentum marginally slowing, the earnings elasticity of consumer discretionary companies may be declining. Investors need to watch for negative signals from similar companies during earnings season, especially those aggressive in inventory management and demand forecasting. The Dick's case reinforces a judgment: in a phase where high rates suppress valuations, earnings blemishes may be punished by sharper valuation compression.
2. Elevated Treasury Yields and Curve Structure: 30-Year at 5.15% and 2-Year at 4.18% Re-anchor Risk Asset Discount Rates
1. Widening Spread Between 30-Year 5.15% and 2-Year 4.18% Reflects Persistent Long-End Inflation and Supply Concerns
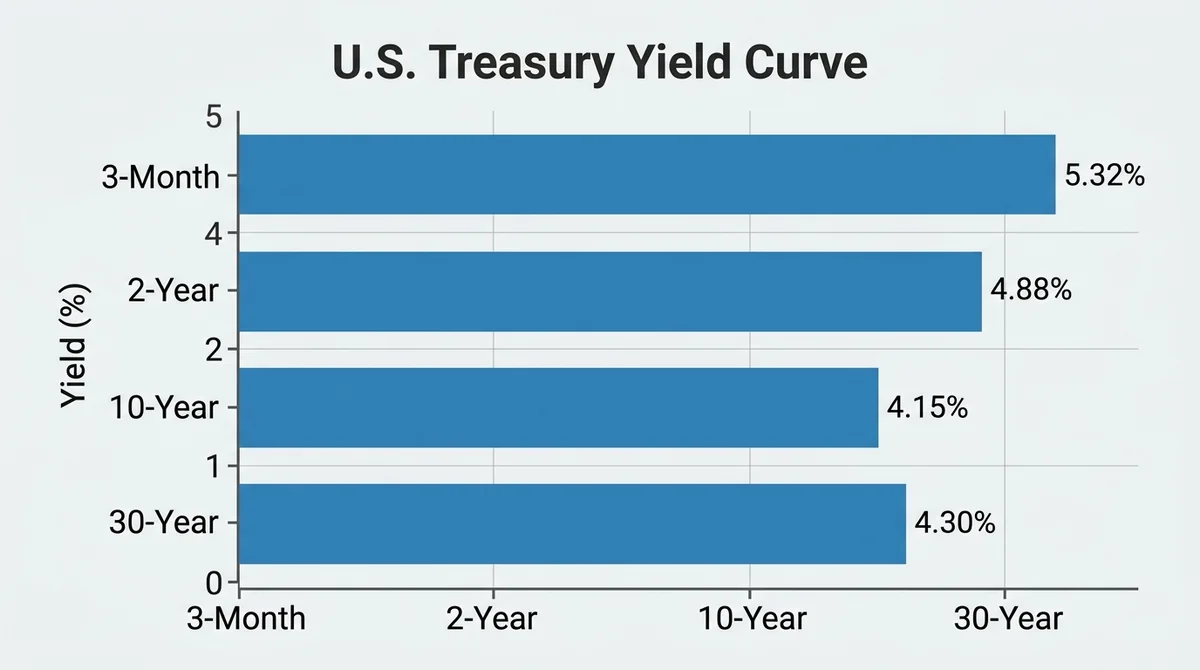
As of Tuesday, the 30-year Treasury yield was 5.15%, the 10-year 4.62%, the 2-year 4.18%, and the 3-month 3.79%. The spread between the 30-year and 2-year is as wide as 97 basis points, showing a clear steepening feature. This structure indicates that long-end rates are significantly higher than short-end rates, and market concerns about long-term inflation and bond supply may not have dissipated. Typically, a steep yield curve suggests the economy may face reflationary pressure or supply shocks from widening fiscal deficits. In the current environment, elevated long-term rates imply that the market demands a higher term premium to compensate for the risk of holding long-duration bonds. For stocks and crypto assets, rising long-end rates directly raise the discount rate on future cash flows, putting sustained pressure on growth assets.
Treasury Yield Term Structure (as of August 25, 2026)
| Maturity | Yield |
|---|---|
| 30-Year | 5.15% |
| 10-Year | 4.62% |
| 2-Year | 4.18% |
| 3-Month | 3.79% |
30-year Treasury yield 5.15%, 10-year 4.62%, 2-year 4.18%, 3-month 3.79%. The curve is steep at elevated levels, with a term spread of 97 basis points.
Meanwhile, the 2-year yield at 4.18% reflects expectations for Fed policy rates, while the 3-month at 3.79% suggests money-market pricing of short-term liquidity has diverged somewhat. This curve combination is not deeply inverted, but the fact that yields are running at elevated levels is enough to change the baseline for risk assets. The risk-free rate has climbed from near zero in the past to around 5%, significantly raising the required earnings yield and risk premium for stocks. The steepening of Treasury yields at high levels implies the market may be pricing both economic resilience and sticky inflation, meaning risk assets must offer higher expected returns to attract capital. For more macro rate analysis, see Macro Market Analysis.
2. 10-Year 4.62% and 3-Month 3.79% Form a Bear-Steepening Combination That Suppresses Long-Duration Asset Valuations
The 10-year Treasury yield at 4.62% is elevated, while the 3-month at 3.79% is relatively low, giving a spread of 83 basis points. This steepening combination resembles the classic "bear steepening" pattern, where long-end rates rise faster than short-end rates, typically occurring when inflation expectations heat up or fiscal supply pressures increase. For long-duration assets such as growth stocks, tech stocks, and crypto assets, valuations are extremely sensitive to discount-rate changes. When the 10-year yield remains at a high 4.62%, the present value of future cash flows is significantly compressed, keeping downward pressure on valuations. Dick's Sporting Goods' plunge occurred precisely against this macro backdrop: in a 5%-level risk-free rate environment, an earnings blemish at a consumer stock may be seen by the market as a signal requiring even larger valuation adjustments. For more on tech stock valuation analysis, see Tech Stock Investing.
10-year Treasury yield 4.62% and 3-month 3.79% spread 83 basis points; bear-steepening combination suppresses long-duration asset valuations; high risk-free rates demand higher risk premiums.
Moreover, the relatively low 3-month yield may reflect some market expectation for short-term liquidity, but this does not alleviate the overall pressure from elevated long-end rates. For asset allocation, high risk-free rates mean capital has safer alternatives, and the equity market must offer more attractive risk premiums. This Treasury yield structure is likely to continue capping the valuation upside of risk assets, especially companies that rely on long-term growth stories.
3. Nvidia Earnings Window: 5.9% Implied Volatility and Call Option Dominance Suggest Market Pricing Tilted Toward Upside Bets
1. Options Market Implied Move for Nvidia Earnings Was 5.9% as of the Weekend, a Moderate Level
Nvidia will report earnings after the close on Wednesday, and options market data through the weekend showed an implied move of 5.9%. This figure is not extreme—it stands at a moderate level, showing neither extreme panic nor excessive optimism. A 5.9% implied move means the market expects the stock to fluctuate about ±5.9% after the earnings release, but this expectation does not point to extreme risk. Implied volatility reflects the market's pricing of uncertainty; the 5.9% level suggests traders see some room for surprises in Nvidia's earnings but do not expect a sharp drop like Dick's Sporting Goods. This cautious-but-positive pricing matches Nvidia's status as a core AI play.
Nvidia's pre-earnings implied move is 5.9%; call volume exceeds put volume, reflecting a bullish but cautious market stance.
Nvidia's earnings window has always been an important test of risk appetite in the tech sector. In the current environment of elevated Treasury yields, tech stock valuations are also under pressure. Although the 5.9% implied move is not low, it does not reflect panic, which may mean the market still has some confidence in Nvidia's earnings resilience. However, if results fall short of expectations, valuation compression in a high-rate environment could be equally severe, so the 5.9% volatility pricing still embeds downside risk.
2. Call Volume Exceeds Put Volume, Showing Traders Are More Willing to Bet on Upside Breakout After Earnings
The options market also shows that call volume exceeded put volume ahead of Nvidia's earnings. This bullish signal indicates that traders are more inclined to bet on an upside breakout after the earnings report rather than seeking downside protection. Call volume dominance usually reflects market optimism, especially against the backdrop of a strong AI narrative, as investors may expect Nvidia to deliver another beat. But it should be noted that options volume distribution is only a sentiment indicator and does not guarantee actual price action. Before the earnings release, this bullish tilt may have already partially priced in positive expectations.
As a core supplier of AI computing power, Nvidia's earnings not only affect its own stock price but may also reprice risk appetite across the entire tech sector. If earnings beat expectations, it could drive a tech rebound and ease valuation pressure from high rates; if they miss, it could trigger a sector-wide pullback. Therefore, Nvidia's earnings window and Treasury yields together form important variables for U.S. stocks at present.
4. PCE and Personal Income/Spending Data Preview: Expected 0.2% Income Growth, 0.1% Spending Growth, and 3.6% Annual PCE Test Inflation Stickiness
1. Economists Expect July PCE Price Index to Rise 0.1% MoM and 3.6% YoY; Inflation Cooling Still Slower Than Policy Target
Economists expect the U.S. July PCE price index to rise 0.1% month-over-month and 3.6% year-over-year. The expected 3.6% annual PCE rate is still significantly above the 2% policy target, indicating that inflation stickiness may not have dissipated. Although the 0.1% monthly increase shows weak near-term inflation momentum, the elevated annual rate means price levels are still rising, just at a slower pace. This "slow decline from a high base" could be a tricky situation for Fed policy: inflation remains some distance from target, but the phase of rapid rate hikes to curb inflation may have passed. The Fed needs to weigh how long to keep rates high, and whether PCE data meets or deviates from expectations will directly affect Treasury yields and risk asset volatility.
PCE and Personal Income/Spending Expectations (July 2026)
| Indicator | Expected Value |
|---|
This article is produced by the MSXGO editorial team, AI-assisted, and reviewed through an editorial process. Fee rates and figures are subject to each platform's latest official announcements.
FAQ
迪克体育为什么暴跌30%? ▼
迪克体育因财报不及预期且鞋类业务疲软,股价单日暴跌30%,目前股息率为4%。
当前美债收益率各期限是多少? ▼
截至周二,30年期美国国债收益率为5.15%,10年期为4.62%,2年期为4.18%,3个月期为3.79%。
英伟达财报前期权市场隐含波动率是多少? ▼
英伟达将于周三盘后公布财报,期权市场截至周末显示隐含波动率为5.9%,看涨期权交易量超过看跌期权。
经济学家对7月PCE、个人收入和消费者支出的预期分别是多少? ▼
经济学家预期美国7月个人收入增长0.2%,消费者支出增长0.1%,PCE价格指数月增0.1%、年增3.6%。
迪克体育暴跌后股息率是多少? ▼
迪克体育暴跌后股息率为4%。
Finished reading? Ready to try trading?
Tokenized stocks/ETFs, crypto spot, and perpetual futures in one account — perp maker 0.02% / taker 0.045%, RWA spot buy 0.3% / sell 0.
Free sign-up · 3 quick steps