MSX US Stock Daily Watch: Nvidia and First Solar: Nvidia Closes at Record High with 14.7x Forward P/E, First Solar Lags S&P but Valuation Reasonable
Nvidia hits record high at 14.7x P/E; $12.9B Hugging Face deal. First Solar lags S&P but ex-45X EV/EBITDA 20-25x shows valuation anchored.
Article Citation Summary
Nvidia hits record high at 14.7x P/E; $12.9B Hugging Face deal. First Solar lags S&P but ex-45X EV/EBITDA 20-25x shows valuation anchored.
US Stock Daily Watch: Nvidia and First Solar: Nvidia Closes at Record High with 14.7x Forward P/E, First Solar Lags S&P but Valuation Reasonable
2026 This article is approximately 4,800 words and takes about 10 minutes to read.
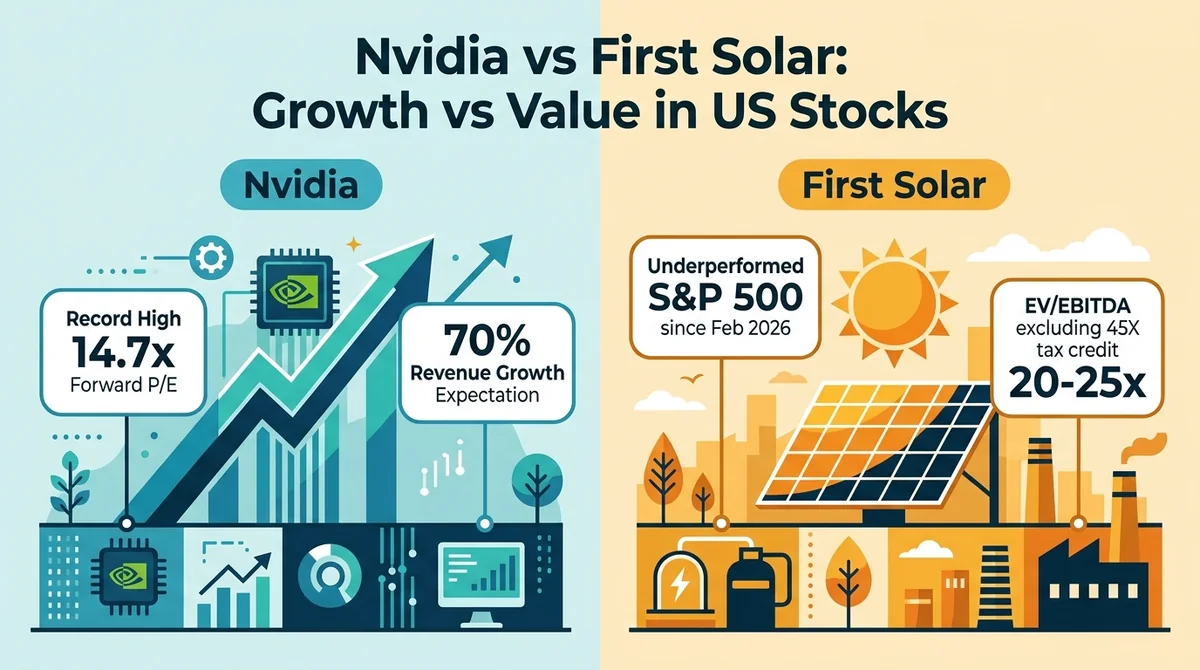
In a single day, Nvidia closed at a record high while trading at about 14.7x forward P/E, while First Solar's relative underperformance sent a different valuation signal — the pricing logic for US technology and clean energy may be diverging.
AI Summary
Core view: At its record high, Nvidia is still seen by some institutions as a hold or buy at about 14.7x forward P/E with a 70% revenue growth expectation, while First Solar's relative underperformance is more due to sentiment and relative style drag rather than a fundamental valuation bubble.
Key elements:
- Nvidia's stock closed at a record high with a forward P/E of about 14.7x (Source: Seeking Alpha, 2026-09-06).
- Analyst Mike Zaccardi reiterated a Buy rating and raised his price target on Nvidia (Source: Seeking Alpha, 2026-09-06).
- Nvidia's acquisition of Hugging Face is valued at $12.9 billion (Source: Seeking Alpha, 2026-09-06).
- First Solar has underperformed the S&P 500 since February despite reaffirming guidance (Source: Seeking Alpha, 2026-09-06).
- First Solar's EV/EBITDA excluding the 45X tax credit is between 20x and 25x (Source: Seeking Alpha, 2026-09-06).
- VGP SA held an analyst/investor day on September 6, 2026, and released a presentation (Source: Seeking Alpha, 2026-09-06).
1. Nvidia hits record high at 14.7x forward P/E, growth expectations offset valuation pressure
1. Closing at a record high combined with ~14.7x forward P/E, Nvidia's growth pricing is in an explainable range
As of September 6, 2026, Nvidia's stock closed at a record high, with a forward P/E of about 14.7x.
In the US stock market, a record high often triggers concerns about overvaluation, but Nvidia's case requires examining P/E in conjunction with growth expectations. The report also noted that the market expects Nvidia's revenue to grow 70% in fiscal 2028. If this growth assumption holds, the 14.7x forward P/E would correspond to significantly higher future earnings, and the current valuation can be understood as part of growth pricing rather than a pure bubble signal.
From a valuation logic perspective, there is no absolute threshold for a reasonable P/E for high-growth companies; the key lies in the credibility and sustainability of growth. In the AI computing track where Nvidia operates, demand is driven by capital expenditure from large tech companies, while supply is constrained by advanced process and packaging capacity, resulting in a relatively tight supply-demand balance. In this context, the expectation of 70% revenue growth is not groundless but based on observable signals from customer orders and data center construction. Therefore, the price action of closing at a record high reflects more of the market's pricing of sustained AI hardware demand exceeding expectations, rather than speculative buying detached from fundamentals. Of course, if subsequent earnings reports show a growth slowdown or cuts in customer capex, the 14.7x forward P/E could be re-evaluated as high, and this risk cannot be ignored.
2. Analyst Mike Zaccardi reiterated Buy and raised target, reinforcing bullish leanings on AI hardware
The same Seeking Alpha report also mentioned that analyst Mike Zaccardi reiterated a Buy rating on Nvidia and raised his price target. Analyst target price adjustments are typically based on upward revisions to revenue, margin, and market share expectations in financial models. Zaccardi's move is not an isolated event; it may reinforce institutional buy-side bullish leanings on the AI hardware sector. When a stock is already at a record high, an analyst choosing to raise the target rather than downgrade to Neutral indicates a positive judgment on new catalysts, such as Nvidia's increasing penetration in inference chips, software ecosystem, and hyperscale data center customers.
However, it should be noted that a single analyst's target adjustment is not enough to constitute a trend signal. Sell-side views are divided; some analysts may focus more on the match between valuation and growth, while others place more weight on long-term AI penetration. Investors should treat Zaccardi's rating as one sample and combine it with other institutional views and subsequent earnings verification, rather than relying on it as a standalone basis. From a factual standpoint, this upgrade at least shows that at Nvidia's record high, some professional investors are still willing to tolerate higher valuations.
3. $12.9 billion acquisition of Hugging Face marks Nvidia's capital move into the AI application layer
The report also disclosed that Nvidia's acquisition of Hugging Face was valued at $12.9 billion. Hugging Face is a key player in AI model hosting and the open-source community, gathering a large number of developers and pre-trained models. This acquisition by Nvidia may mark a capital move extending from pure hardware sales to the AI application layer and developer ecosystem. By integrating Hugging Face's platform capabilities, Nvidia may tightly bind its GPU hardware, CUDA software stack, and open-source model community, building a full-stack moat from chips to applications.
However, a $12.9 billion acquisition is not a small sum for Nvidia, and integration risks and financial amortization may have some impact on near-term profits. From a strategic perspective, the long-term value of this move may be greater than its short-term financial contribution: if Nvidia can leverage Hugging Face's ecosystem stickiness to push more enterprise customers to train and deploy models on its hardware, the deal will strengthen its AI infrastructure dominance. Nevertheless, the integration effect will take several quarters to materialize, and investors should not treat the acquisition news as an immediate stock catalyst but rather focus on the actual progress of product synergies and developer migration.
2. First Solar lags S&P 500, but ex-45X tax credit EV/EBITDA of 20-25x shows valuation not dislocated
1. Underperforming S&P 500 since February, First Solar's relative weakness not reversed by reaffirmed guidance
As of September 6, 2026, First Solar has underperformed the S&P 500 index since February, despite the company reaffirming guidance.
This phenomenon may indicate that the overall market sentiment toward the clean energy sector remains cautious; even if management reaffirms performance guidance, it has not reversed the relative weakness. As a leading thin-film photovoltaic company, First Solar's profitability relies heavily on the 45X advanced manufacturing tax credit under the US Inflation Reduction Act, but the market may worry about policy sustainability, subsidy phase-out pace, and PV module price competition.
From a capital flow perspective, when the AI hardware sector continues to attract incremental funds, policy-sensitive defensive sectors often face relative discounts. First Solar's underperformance may not be due to a major deterioration in its own operations but rather a relative performance during a style rotation. Reaffirming guidance typically means recent orders and shipments are in line with management expectations, but this signal has not been fully priced by the market. This shows that in a trading day with risk appetite tilted toward high growth, fundamentally sound but lacking explosive catalysts tend to be temporarily overlooked. However, if relative weakness persists too long, it may also trigger valuation repair opportunities, which need to be observed in conjunction with subsequent policy and industry data.
2. Excluding the 45X tax credit, EV/EBITDA is in the 20-25x range, providing a margin of safety for clean energy valuation
The report further pointed out that First Solar's EV/EBITDA excluding the 45X tax credit is between 20x and 25x. EV/EBITDA measures a company's enterprise value relative to its earnings before interest, taxes, depreciation, and amortization. After excluding tax credits, this metric better reflects the capitalization level of First Solar's core operations without distortion from policy subsidies. A range of 20-25x, relative to the long-term growth potential of the photovoltaic industry and First Solar's technological leadership, may not indicate obvious froth; if the market broadly worries about subsidy cuts, this valuation level may provide a certain margin of safety.
The key here is the adjustment of "excluding the 45X tax credit." With subsidies present, the company's EBITDA is significantly inflated, thereby lowering the EV/EBITDA multiple and creating a false impression of undervaluation; if subsidies are removed, earnings would drop sharply and valuation could become expensive. Therefore, using the metric excluding subsidies provides a more realistic assessment of First Solar's core competitiveness. Based on this metric, even if policy subsidies completely disappear, the market's pricing of First Solar's core business remains within a relatively rational range. Thus, First Solar's underperformance is more due to sentiment and relative style drag rather than an absolute valuation bubble. Investors should distinguish between "relative underperformance" and "fundamental deterioration" and avoid mistaking short-term style fluctuations for a long-term trend reversal.
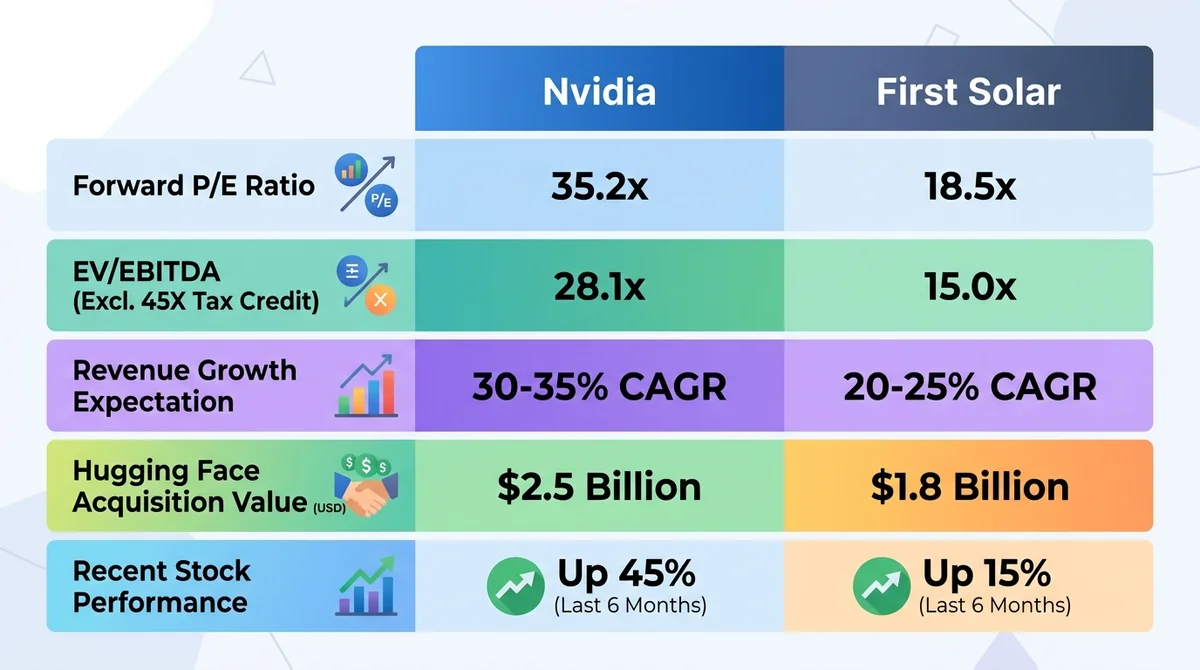
Key Metrics Comparison: Nvidia vs. First Solar (2026-09-06)
| Metric | Nvidia | First Solar |
|---|---|---|
| Stock performance | Closed at a record high | Underperformed S&P 500 since February |
| Valuation metric | Forward P/E ~14.7x | EV/EBITDA 20-25x ex-45X tax credit |
| Key events | Analyst reiterated Buy and raised target; $12.9B acquisition of Hugging Face | Company reaffirmed guidance but failed to reverse relative weakness |
| Market pricing logic | Growth pricing | Policy pricing |
3. VGP SA investor day on the same day releases presentation, rising density of institutional events reflects multi-theme pricing game
1. VGP SA held analyst/investor day on September 6, 2026, and released presentation; concentrated institutional information release
On the same day that Nvidia and First Solar became market focal points, VGP SA held an analyst/investor day on September 6, 2026, and released a presentation. VGP SA may not be a core US stock asset, but this event reflects the increased density of institutional information release within a single trading day. When multiple companies simultaneously conduct investor communications, release strategic updates, or provide guidance, market participants need to digest more information in less time, which often intensifies multi-theme pricing games.
The concentration of institutional events usually occurs around earnings seasons or periods of heightened market sentiment divergence. Early September 2026 may represent a window of transition from low volatility in summer to higher volatility in autumn for US stocks, with AI hardware, clean energy, interest-rate-sensitive assets, and other themes under simultaneous scrutiny. VGP SA's investor day, while not directly affecting Nvidia or First Solar's stock prices, serves as part of the background noise, reminding observers that current market pricing is not driven by a single thread but is the result of multiple institutional narratives interwoven. In such an environment, the price signal of a single asset may be disturbed by information flows from other sectors, so individual stock performance must be understood within the overall market structure.
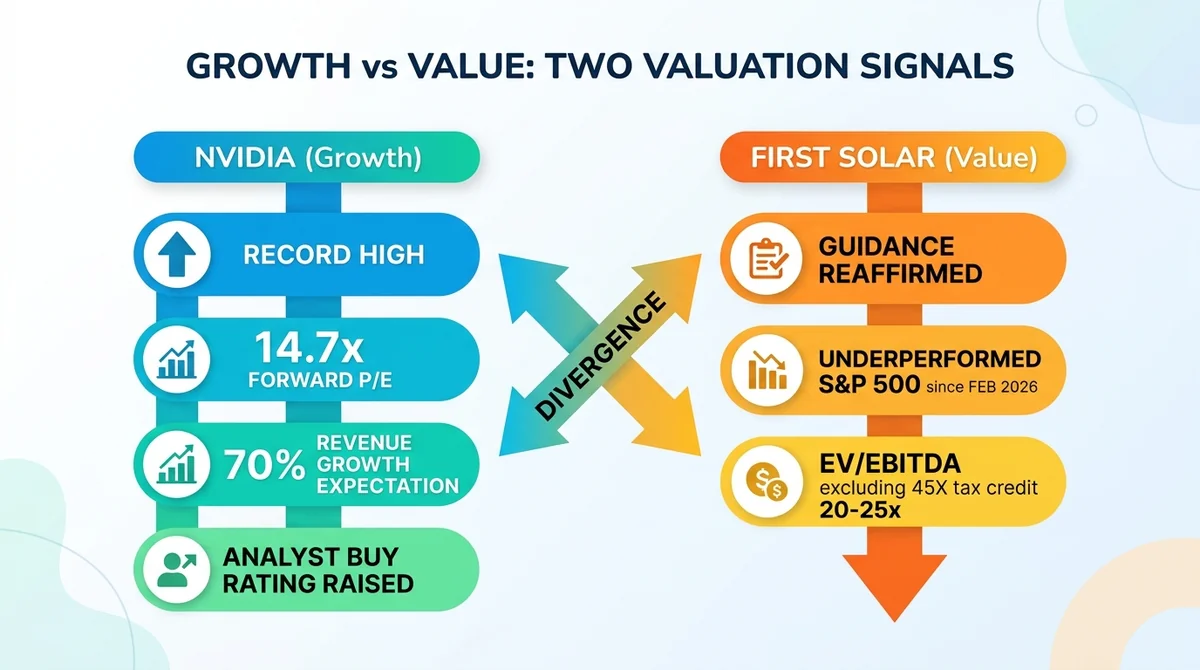
2. Nvidia and First Solar show high-low contrast on the same day, market risk appetite tilts toward AI hardware
Nvidia's record high and First Solar's underperformance of the S&P formed a same-day contrast. This contrast is not coincidental but a direct reflection of market risk appetite tilting toward AI hardware. The high-growth story of the AI hardware sector is more offensive, with earnings expectations closely tied to corporate capex cycles; while the clean energy sector is more influenced by policy variables, making it a policy-sensitive defensive asset. In an environment of recovering risk appetite and stable economic growth expectations, funds tend to chase high-beta growth stocks, thereby relatively suppressing clean energy with high policy dependence.
This high-low contrast does not mean that clean energy fundamentals are deteriorating, nor that AI hardware has entered a risk-free rally. In fact, the two represent two pricing logics in the market: growth pricing and policy pricing. Nvidia's rise is built on the expectation of 70% revenue growth; if growth falls short, the downside risk is equally significant. First Solar's underperformance may provide a window for contrarian investors, but only if policy negatives are exhausted or relative strength shows a turning point. Therefore, observers should not simply view the same-day performance as "winner takes all" but should see the market's dynamic process of risk rebalancing between two main themes.
4. US stock daily watch framework: Using valuation metrics and relative strength to deconstruct "record high" and "underperformance" signals
1. Nvidia case: 14.7x forward P/E must be validated with 70% revenue growth in fiscal 2028
In daily US stock observation, a "record high" alone is not sufficient as a buy or sell signal. Nvidia's forward P/E of 14.7x only appears reasonable under the assumption of expected 70% revenue growth in fiscal 2028. If future growth falls short, the 14.7x forward P/E could be redefined as overvalued; conversely, if growth exceeds expectations, the current valuation may still be low. Therefore, observers must tie P/E to growth expectations, avoiding looking at absolute value alone or growth rate alone.
The practical significance of this framework is that valuation metrics are neutral in themselves, and their meaning depends on the credibility of growth assumptions. Nvidia's growth expectation comes from the visibility of AI data center capex, customer concentration, and competitive landscape. When evaluating, one needs to simultaneously monitor customer capex guidance, order lead times, and competitor product progress. If these leading indicators deteriorate, even if the stock price is still near record highs, valuation pressure will quickly emerge. Conversely, if leading indicators remain strong, the 14.7x forward P/E may just be the mid-game of the growth story, not the end. Therefore, "record high" needs to be decomposed into "reasonable valuation under high growth" and "sentiment-driven overpricing," and distinguished through forward-looking data.
2. First Solar case: EV/EBITDA excluding policy subsidies better reflects capitalization level of core business
If one only looks at price, First Solar's relative underperformance easily leads to the conclusion of "weakening fundamentals." But the EV/EBITDA excluding the 45X tax credit falls within the 20-25x range, showing that the capitalization level of the core business has not deviated from a reasonable range. Policy subsidies contribute significantly to solar companies' earnings but also distort judgment of core competitiveness. Using metrics excluding subsidies helps identify the true pricing of the core business, avoiding the simplistic logic of "underperformance equals bearish."
This case reveals the complex relationship between relative strength and absolute valuation. Relative underperformance may be caused by sector rotation, capital preference, or sentiment shocks, while absolute valuation reflects intrinsic value. In daily US stock observation, if one only tracks price relative to the S&P 500, one may miss quality stocks that have been wrongly sold off; conversely, if one only looks at absolute valuation, one may overlook persistent discounts caused by market style suppression. Therefore, the best practice is to combine relative strength with valuation metrics that exclude policy distortions: when relative underperformance occurs but absolute valuation is in a reasonable or low range, further judge whether the driver of underperformance is a temporary style factor or a permanent fundamental deterioration. First Solar's case reminds us that policy-sensitive assets often exhibit divergence between valuation and price during style rotation periods, and such divergence may offer opportunities for patient observers.
3. Subsequent observation: target price adjustments, relative S&P performance, and institutional investor days are three tracking anchors
Subsequent observation can focus on three anchors: whether Nvidia's target price continues to be upgraded by institutions, whether First Solar's relative performance against the S&P 500 converges, and whether institutional investor days release strategic signals densely. Target price adjustments reflect marginal changes in sell-side expectations; relative performance reveals the sustainability of capital style rotation; institutional investor days provide forward-looking management guidance. Combined, these three can offer investors a more three-dimensional market thermometer.
Specifically, if upgrades to Nvidia's target price form a cluster effect, it may indicate that earnings expectations for the AI hardware sector are being systematically revised upward, which would support the stock price continuing to digest valuation at high levels; if upgrades are sporadic, they may just be individual behavior and insufficient to change overall risk appetite. If First Solar's relative performance against the S&P 500 shifts from persistent underperformance to convergence, it may suggest that the outflow of funds from the clean energy sector is nearing an end and policy negatives or style suppression are weakening; conversely, if the underperformance widens, one should be alert to further deterioration in fundamentals or policy. Institutional investor days (such as VGP SA's investor day) may seem independent, but if they occur densely in a short period, they often represent listed companies centrally conveying the latest strategic and financial information to the market, which helps observers capture marginal changes in industry capex, technology routes, and competitive landscape.
Final Thoughts
In a single day, Nvidia and First Solar provided two valuation narratives: relatively reasonable high-growth AI hardware and relative discount in clean energy. Nvidia's valuation advantage comes from growth expectations, while First Solar's valuation reasonableness comes from core business metrics excluding subsidies. The market may be rebalancing between high-growth offensive and policy-sensitive defensive positions. This rebalancing is not an either-or choice but a dynamic migration of risk appetite. Observers need to keep an eye on both growth realization and policy variables, avoiding being overly swayed by a single trading day's price signal.
From a more macro perspective, when the Fed's policy path, AI capex cycle, and clean energy subsidy policy are intertwined, the US stock market is entering a phase of multiple parallel themes.
FAQ
Q: What was Nvidia's stock performance and valuation on September 6, 2026? A: Nvidia's stock closed at a record high with a forward P/E of about 14.7x
This article is produced by the MSXGO editorial team, AI-assisted, and reviewed through an editorial process. Fee rates and figures are subject to each platform's latest official announcements.
FAQ
英伟达在2026年9月6日的股价表现和估值如何? ▼
英伟达股价收盘创历史新高,远期市盈率约14.7倍,预期2028财年收入增长70%。(来源:Seeking Alpha)
分析师对英伟达的最新评级和目标价有何变化? ▼
分析师 Mike Zaccardi 重申买入并上调目标价。(来源:Seeking Alpha)
英伟达收购Hugging Face的交易金额是多少? ▼
英伟达收购Hugging Face的交易金额为129亿美元。(来源:Seeking Alpha)
First Solar 自2月以来相对标普500表现如何? ▼
First Solar 自2月以来跑输标普500指数,尽管公司重申指引。(来源:Seeking Alpha)
First Solar 剔除45X税收抵免后的EV/EBITDA是多少? ▼
First Solar 排除45X税收抵免后的EV/EBITDA在20倍至25倍之间。(来源:Seeking Alpha)
VGP SA 在2026年9月6日有什么活动? ▼
VGP SA 于2026年9月6日举办分析师/投资者日并发布演示文稿。(来源:Seeking Alpha)
Finished reading? Ready to try trading?
Tokenized stocks/ETFs, crypto spot, and perpetual futures in one account — perp maker 0.02% / taker 0.045%, RWA spot buy 0.3% / sell 0.
Free sign-up · 3 quick steps