MSX US Stocks Daily Watch: Semiconductor Pullback Signals vs. Consumer Stock Contrast: Semiconductor ETF Double Top Tests $500 Support, Qualcomm Handset Chip Revenue Falls 26%, E.l.f. Beauty Sales Rise 51% and Raises Guidance
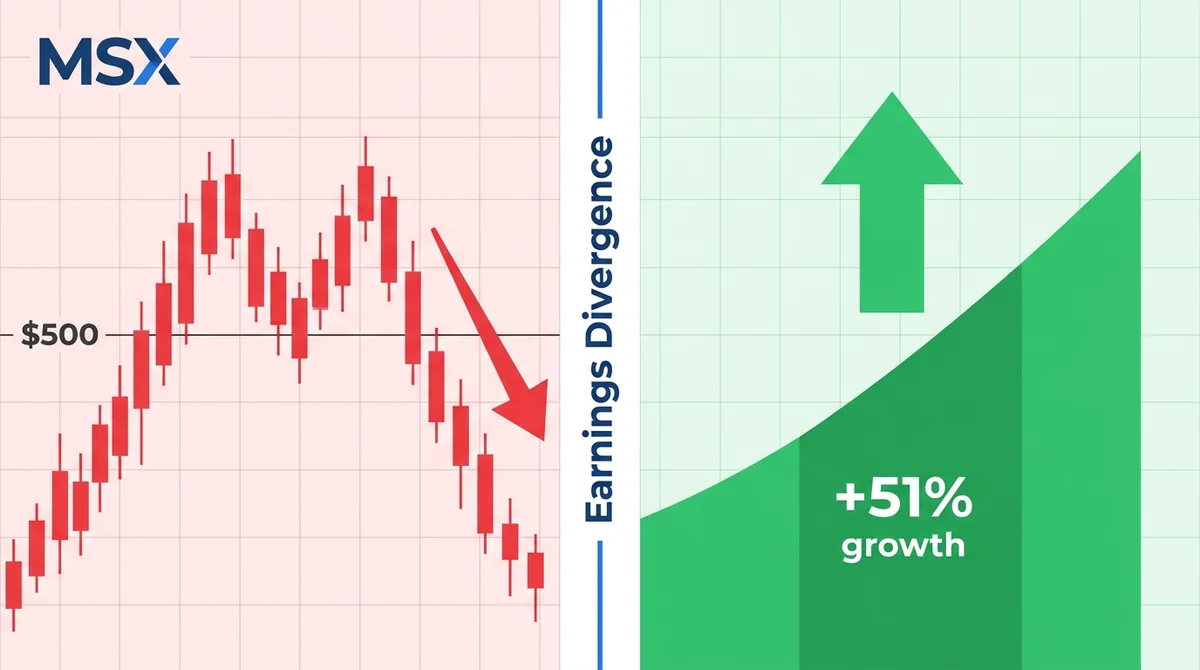
Nov 4, 2026 earnings divergence: VanEck Semiconductor ETF forms a double top at $500 with put gamma dominant, Qualcomm handset chip revenue -26% YoY with weak guidance, E.l.f. Beauty net sales +51% and raises full-year guidance.
Article Citation Summary
Nov 4, 2026 earnings divergence: VanEck Semiconductor ETF forms a double top at $500 with put gamma dominant, Qualcomm handset chip revenue -26% YoY with weak guidance, E.l.f. Beauty net sales +51% and raises full-year guidance.
MSX US Stocks Daily Watch: Semiconductor Pullback Signals vs. Consumer Stock Contrast: Semiconductor ETF Double Top Tests $500 Support, Qualcomm Handset Chip Revenue Falls 26%, E.l.f. Beauty Sales Rise 51% and Raises Guidance
MSX Research
Guest Columnist
@MSX_CN
November 2026
This article is about 4,800 words and takes about 12 minutes to read.
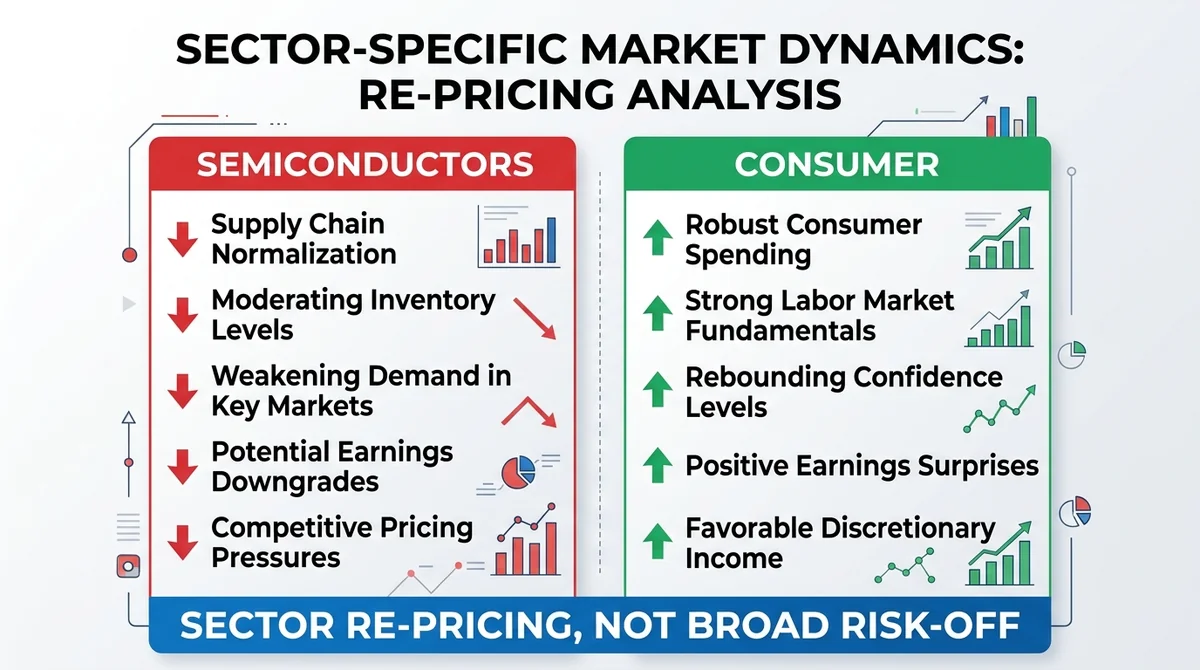
On the same day, the semiconductor sector flashed pullback signals in both technical patterns and options positioning, while a value beauty company delivered evidence pointing in the completely opposite direction with 51% net sales growth and raised full-year guidance. This is not a broad contraction in risk appetite, but rather a sector re-pricing driven by both cost constraints and demand resilience.
AI Summary
Core View: The two sets of earnings and market signals on November 4, 2026 point to the same conclusion—the main theme in US stocks right now is earnings divergence and capital reallocation across sectors, not a single-direction broad risk-off move. The semiconductor sector is under pressure from earnings visibility constraints caused by rising memory costs and supply constraints, while the consumer sector is benefiting from guidance upgrades driven by resilient value demand. Their drivers are different and should not be combined into a macro risk event.
Key Elements:
- According to a Seeking Alpha analysis on November 4, 2026, the VanEck Semiconductor ETF is testing key support at $500, and a break below could lead to further declines toward $480 or even $400.
- The same analysis notes that put option positioning has accumulated in the semiconductor sector, with put gamma dominant, and combined with the double top pattern at $500, this indicates weakening sector sentiment and rising downside risk.
- According to a CNBC report on November 4, 2026, Qualcomm's fiscal Q4 2026 adjusted EPS was $2.17 and revenue was $10.32 billion, both above market expectations, but the company's guidance was weak and the stock fell about 5% after hours.
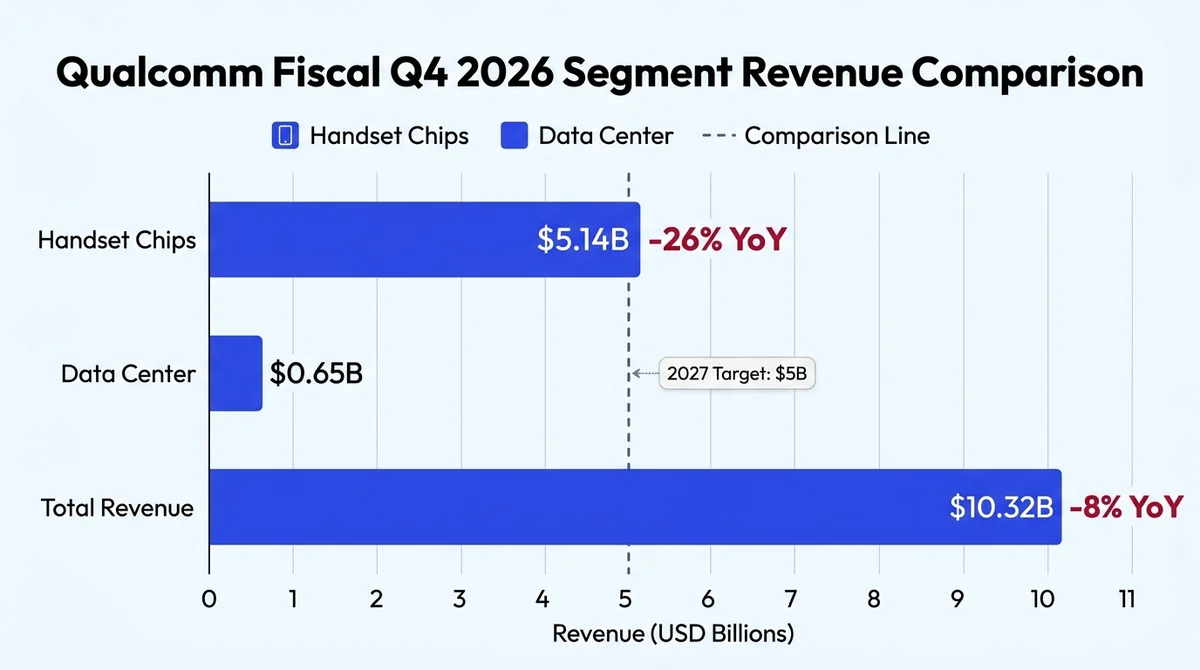
- Qualcomm's handset chip quarterly sales fell 26% year-over-year to $5.14 billion, and total company revenue fell 8% year-over-year; the report attributes the main cause to rising memory costs pushing up handset prices and suppressing demand.
- Qualcomm CEO Amon said the company's data center business generated $650 million in revenue in the quarter and expects data center revenue to reach $5 billion in fiscal 2027, calling the current situation a supply issue rather than a demand issue.
- According to CNBC, E.l.f. Beauty's fiscal Q2 2027 net sales rose 51% year-over-year to $520.8 million, with adjusted EPS of $1.21, far exceeding the market expectation of 60 cents.
- E.l.f. Beauty raised its full-year guidance, with net sales expected to rise to $2.00–2.03 billion and adjusted EPS expected to rise to $3.82–$3.86.
1. Semiconductor Sector Forms Double Top at $500 Level; Put Gamma Dominance Means Downside Risk Is Amplified
1. VanEck Semiconductor ETF Is Testing Key Support at $500; Double Top Pattern Enters Verification Phase
According to an analysis published by Seeking Alpha on November 4, 2026, the VanEck Semiconductor ETF is testing the key support level of $500. Technically, the ETF has formed a double top structure near $500 and is currently in a critical window for pattern verification. A double top is one of the widely discussed reversal patterns in technical analysis; its core meaning is that the same price level was tested twice without success, indicating persistent selling pressure above that level.
The reason $500 is considered key is not only that it is a round number, but also that it is the neckline of the double top pattern. Once the price effectively breaks below this level, the downside implied by the pattern opens up. The Seeking Alpha analysis gives downside reference levels of $480 and $400. This means $500 to $480 is the first retracement target, while $400 corresponds to a deeper correction scenario. For funds tracking the semiconductor sector, this price path provides a reference coordinate for short-term risk management.
It should be emphasized that a double top pattern itself is not an inevitable prediction of a decline; it is more like a shift in the center of gravity of a probability distribution. The process of repeated battles around the neckline is often also a window for bulls and bears to reassess fundamental information. This window currently overlaps with fundamental variables such as Qualcomm's earnings and rising memory costs, giving the technical verification process fundamental support, which is why this signal deserves attention. Note, however, that both the technical pattern and the options structure come from a single third-party analysis and have not yet been cross-validated by multiple sources.
2. Put Option Positioning Accumulates and Put Gamma Dominates; Sector Sentiment Has Shifted from Chasing Gains to Defense
The same analysis notes that put option positioning in the semiconductor sector is accumulating and put gamma is dominant. The options market positioning structure is a high-frequency window into capital sentiment: when put option positioning continues to accumulate, it means more capital is willing to pay premiums for downside risk; and when put gamma dominates, market makers' hedging behavior patterns change directionally.
From the perspective of market maker hedging mechanics, in a negative gamma environment, market makers sell the underlying when prices fall and buy when prices rise to maintain delta neutrality. This hedging behavior is directionally aligned with price moves and may therefore amplify volatility during a decline. This is precisely why put gamma dominance is closely watched by market participants—it does not necessarily change the medium-term direction of prices, but it may significantly change the magnitude and speed of short-term price volatility.
Looking at the options structure and technical pattern together, they point in the same direction: the double top at $500 provides resistance confirmation at the price level, while put option positioning and the gamma structure provide sentiment confirmation at the capital level. With both technicals and capital flows weakening simultaneously, the downside risk in the semiconductor sector is no longer a single-dimensional guess but has received dual confirmation. However, the evidence for this conclusion is still concentrated in the same analysis, and its methodology (such as gamma calculation and positioning statistics scope) is not disclosed in the source, so it should be treated with caution.
3. If $500 Is Lost, $480 and $400 Constitute the Two Reference Levels for This Downside Leg
After clarifying the support level and sentiment structure, the market's real concern is the path. The Seeking Alpha analysis provides two clear downside reference levels: $480 and $400. These two levels do not carry the same meaning. $480 is only 4% away from $500, closer to a normal technical retracement; while $400 corresponds to a roughly 20% correction, a scenario that would require fundamental support to materialize.
From a trading structure perspective, the $500–$480 range is the first target zone after a neckline break of the double top pattern, and battles in this range are often accompanied by increased volume and concentrated adjustments in options hedges. If the price finds support in this range and reclaims $500, the double top pattern would be invalidated, and previous bearish positioning could face unwinding pressure, which could instead create upward momentum. Conversely, if $480 is also effectively broken, $400 will become the next reference level for the market to anchor to.
For investors watching tokenized US stock products, the significance of such key price levels is that they provide an observable, verifiable risk scale. Whether trading the ETF itself or related derivative structures, the three numbers $500, $480, and $400 form a tiered framework to help judge which stage of the pullback we are currently in. Note that tokenized products may carry additional premiums, liquidity discounts, and counterparty risk, and are not completely equivalent to the ETF's own price path.
2. Qualcomm Beats but Guidance Is Weak; Handset Chip Revenue Falls 26% YoY, Revealing Real Pressure on the Demand Side
1. Adjusted EPS of $2.17 and Revenue of $10.32 Billion Both Beat Expectations, Yet the Stock Fell About 5% After Hours
According to a CNBC report on November 4, 2026, Qualcomm's fiscal Q4 2026 adjusted EPS was $2.17, with revenue of $10.32 billion, both above market expectations. On the current numbers alone, this is a standard beat. Yet the market reaction was the opposite: the company's guidance was weak, and the stock fell about 5% after hours.
This combination of "numbers beat, stock falls" is a phenomenon worth studying repeatedly during earnings season. It shows that the market's pricing focus for a company does not stay on the quarterly numbers already reported but shifts forward to the growth visibility for the next fiscal year. When the forward information conveyed by guidance is weaker than the historical information conveyed by current numbers, capital will prioritize pricing the former. Qualcomm's after-hours performance that day is an intuitive sample of this mechanism.
From an expectations gap perspective, EPS of $2.17 and revenue of $10.32 billion show that Qualcomm's cost control and product mix were effective in the current quarter. But weak guidance means the company itself is cautious about the revenue and profit pace in the next stage. For stocks priced on discounted future cash flows, the marginal change in forward guidance often has a greater impact on valuation than a small beat in current results.
2. Handset Chip Quarterly Sales Fell 26% YoY to $5.14 Billion; Rising Memory Costs Push Up Handset Prices and Suppress Demand
The most informative number in the earnings report is handset chip business quarterly sales: down 26% year-over-year to $5.14 billion. Meanwhile, total company revenue fell 8% year-over-year. The difference between these two declines shows that the handset chip business fell significantly more than the company overall and was the main drag on total revenue.
The CNBC report points to rising memory costs as the cause: higher memory prices pushed up the manufacturing cost of handsets, which in turn pushed up handset prices and ultimately suppressed end demand. This is a complete cost transmission chain—upstream component prices rise, midstream device makers face higher costs, downstream consumers delay upgrades in the face of higher prices, and this ultimately feeds back into orders for chip suppliers. As a core supplier of handset chips, Qualcomm sits in the middle of this chain, bearing both cost-side pressure and demand-side contraction.
The significance of this transmission chain extends beyond Qualcomm alone. If rising memory costs are industry-wide, then all hardware manufacturers that rely on memory may face similar cost pressure. Handsets are just the first end category to show it, as they have high price elasticity and demand is more sensitive to price increases. This is why the 26% year-over-year decline deserves separate discussion—it is not just a company number but may also be a reading of the industry's cost environment. Note, however, that the 26% decline may also include factors such as Qualcomm's own product mix, competitive landscape, or customer inventory adjustments; the report does not break down the contribution of each factor, so attribution should be cautious.
3. CEO Amon Says It Is a Supply Issue, Not a Demand Issue; Data Center Business Revenue Was $650 Million in the Quarter, with a $5 Billion Target for Fiscal 2027
Faced with weak handset chip data, Qualcomm CEO Amon offered his own explanatory framework. According to CNBC, Amon said the current situation is a supply issue rather than a demand issue. This statement attempts to shift market attention from demand contraction to supply constraints, implying that end demand for chips has not disappeared but is temporarily suppressed by costs and supply conditions.
At the same time, Qualcomm provided an update on its data center business: quarterly revenue of $650 million, with data center revenue expected to reach $5 billion in fiscal 2027. The gap between this target and the current quarter's $650 million constitutes Qualcomm's most important growth narrative over the next two years. The data center business is seen as a key direction for Qualcomm's diversification away from handsets, and the pace of its revenue ramp will directly affect the market's judgment of Qualcomm's long-term growth curve.
However, there is tension between management's explanation and market pricing. Amon's "supply issue" framework needs data from subsequent quarters to verify: if handset chip revenue rebounds quickly after supply conditions improve, then the explanation holds; if revenue remains under pressure, then demand-side factors may be underestimated. Similarly, the fiscal 2027 data center revenue target of $5 billion is clear, but the path from $650 million to $5 billion needs to be delivered quarter by quarter. The combination of an earnings beat and weak guidance essentially reflects the market's wait-and-see attitude toward these two verification lines.
3. E.l.f. Beauty Net Sales Rise 51% and Full-Year Guidance Is Raised, Creating a Sharp Consumer Stock Contrast with Semiconductors
1. Fiscal Q2 2027 Net Sales Rose 51% YoY to $520.8 Million; Adjusted EPS of $1.21 Far Exceeded the Expected 60 Cents
According to a CNBC report on November 4, 2026, E.l.f. Beauty's fiscal Q2 2027 net sales rose 51% year-over-year to $520.8 million, with adjusted EPS of $1.21, far exceeding the market expectation of 60 cents. The combination of these two numbers deserves separate analysis: 51% net sales growth shows the company is in a state of rapid revenue expansion, while EPS at nearly twice the market expectation shows that profit release exceeded analysts' model assumptions.
In the consumer industry, high revenue growth and profit beats rarely appear together. Usually high growth requires marketing spend or price concessions, which suppresses margins. E.l.f. Beauty achieving both shows that its growth is not driven solely by expenses and that product mix and pricing power played a role. For a beauty company positioned as value, this combination is especially noteworthy because it suggests that a value positioning may be an advantage rather than a disadvantage in the current consumer environment. Note that single-quarter data may also be affected by acquisition contributions, base effects, or one-time items; the report did not disclose such breakdowns.
From an expectations gap perspective, the gap between the 60-cent market expectation and the actual $1.21 result is the strongest signal in this earnings report. The direction and magnitude of the expectations gap often explain stock price reactions better than absolute numbers, because it measures the degree to which market consensus has been revised.
2. Full-Year Guidance Raised to Net Sales of $2.00–$2.03 Billion and Adjusted EPS of $3.82–$3.86
More significant than the single-quarter beat is the guidance raise. CNBC reports that E.l.f. Beauty raised its full-year net sales expectation to $2.00–$2.03 billion and adjusted EPS expectation to $3.82–$3.86. A guidance raise means management has sufficient confidence in demand visibility for subsequent quarters and is willing to publicly commit to that confidence in numerical form.
During earnings season, the direction of guidance often determines capital flows more than the magnitude of the current beat. Raising guidance means the company has proactively raised its future performance benchmark and placed itself at a higher delivery threshold; lowering or weak guidance does the opposite, reducing market visibility. When one company raises guidance and another gives weak guidance on the same trading day, reallocation of capital between them is almost inevitable.
From a valuation perspective, the raised guidance range provides a clear benchmark for subsequent delivery. The ranges of $2.00–$2.03 billion in net sales and $3.82–$3.86 in adjusted EPS will become the yardstick by which the market measures whether the company "walks the talk" when the next earnings report is released. The sustainability of the valuation support from the guidance raise depends on whether this yardstick can be met quarter by quarter.
3. Semiconductor Pressure and Beauty Consumer Volume on the Same Day Form the Most Intuitive Sample of Sector Divergence This Earnings Season
Putting Qualcomm and E.l.f. Beauty on the same day's timeline yields two earnings signals pointing in opposite directions. On one side is a semiconductor company whose current numbers beat but guidance is weak, with handset chip revenue down 26% year-over-year; on the other side is a beauty company whose net sales rose 51% year-over-year, EPS far exceeded expectations, and full-year guidance was raised. This same-day contrast is the most intuitive sample for observing sector divergence.
Behind the divergence are different drivers. The semiconductor sector is under pressure from rising costs and supply constraints, which is supply-side pressure; the consumer sector is benefiting from resilient value demand, which is demand-side support. The two are not two sides of the same coin but different performances of two relatively independent economic links at the same point in time. Understanding this is crucial for judging capital flows: capital may not be making a binary choice between "risk assets" and "safe-haven assets," but rather making relative allocations among sectors with different fundamentals.
For investors watching tokenized US stock products, this divergence provides an observation dimension: when earnings directions across sectors diverge significantly, the performance of a single index may mask dramatic changes in internal structure. Understanding the drivers of divergence is more useful for grasping the logic of capital migration than simply tracking index levels.
4. Two Sets of Earnings Signals Plus Options Structure Point to Sector Rotation, Not a Broad Contraction in Risk Appetite
1. Semiconductor Pressure Comes from Cost and Supply Constraints, Consumer Volume Comes from Resilient Value Demand; Their Drivers Are Not the Same
Summarizing the facts above, the sources of pressure on the semiconductor sector are clear: rising memory costs pushing up handset prices and suppressing demand, as described by Qualcomm, and weakening capital sentiment reflected in accumulated put option positioning and put gamma dominance at the ETF level. One is a fundamental cost constraint, the other a market structure phenomenon, and together they constitute the short-term pressure on the semiconductor sector.
The sources of strength in the consumer sector are equally clear: E.l.f. Beauty's net sales up 51% year-over-year, adjusted EPS of $1.21 far exceeding the expected 60 cents, and a full-year guidance raise. This is demand-driven earnings volume, completely different in nature from the semiconductor cost constraints.
Different drivers mean the two types of signals should not be interpreted together. If semiconductor weakness and consumer strength stemmed from the same macro variable, they might point to a broad change in risk appetite; but current facts show their causes lie in different links on the supply and demand sides, so a more reasonable interpretation is structural sector rotation. This judgment is speculative and is not yet directly supported by capital flow data.
2. Put Gamma Dominance Amplifies Short-Term Volatility in the Semiconductor Sector Alone, Not a Market-Wide Liquidity Event
The phenomenon of put gamma dominance needs to be understood within the correct scope. According to the Seeking Alpha analysis, accumulated put option positioning and put gamma dominance occur at the semiconductor sector level, and their direct impact is that market makers' hedging behavior in sector-related underlyings may amplify short-term volatility. This is a sector-level capital phenomenon whose scope is specific underlyings and related options chains.
It is important to distinguish this from a market-wide liquidity event. A market-wide liquidity event usually manifests as synchronized cross-asset selling, a sharp rise in funding costs, and contraction of market makers' balance sheets, with an impact far beyond a single sector. The currently observed put gamma dominance is evidenced only by the options positioning structure in the semiconductor sector and does not yet constitute evidence of cross-asset contagion.
The significance of this distinction for judgment is: if the pressure is sector-level, capital flowing out of semiconductors may flow into other sectors, forming rotation; if the pressure is market-wide, capital will contract overall and all sectors will come under pressure simultaneously. Current facts support the former scenario more, although this judgment needs continuous verification with subsequent data.
3. During Earnings Season, Guidance Direction Determines Capital Migration Across Sectors More Than Current Beats
The cases of Qualcomm and E.l.f. Beauty together reveal a rule of earnings season: the direction of guidance determines the path of capital migration more than the magnitude of the current beat. Qualcomm's current EPS of $2.17 and revenue of $10.32 billion both beat expectations, but the stock fell about 5% after hours due to weak guidance; E.l.f. Beauty not only far exceeded expectations in current data but also raised full-year guidance, and the combination created stronger capital appeal.
The logic behind this rule is the time dimension of valuation. Stock pricing is based on discounted future cash flows; current results are already past, while guidance conveys future information. When guidance is raised, analysts need to raise earnings forecast models, and target prices move up accordingly; when guidance is weak, the model downgrade process brings valuation compression. This process has little to do with whether current numbers beat expectations, but it may directly affect capital flows across sectors.
Therefore, during the peak of earnings season, observing changes in guidance direction is more informative than counting the number of companies that beat expectations. The current sample suggests that capital may be flowing from sectors with declining earnings visibility to sectors with rising visibility, and whether this migration path continues to appear over the next several trading weeks still needs to be observed.
5. Risks to Watch Are Concentrated on Three Lines: $500 Support, Guidance Delivery, and Cost Transmission
1. If the Semiconductor ETF Breaks Below $500, the Downside Path to $480 and $400 Will Be Activated
The first trigger line for technical risk is the $500 support of the VanEck Semiconductor ETF. According to the Seeking Alpha analysis, the ETF is testing this key level, and a break below could lead to further declines toward $480 or even $400. The reason $500 is key is that it is both the neckline of the double top pattern and a round-number psychological level; the overlap of the two amplifies the significance of holding or losing this level.
From a risk management perspective, this price path provides clear observation markers. If the price stabilizes above $500, the double top pattern is not yet confirmed, and previous bearish positioning may face unwinding; if the price effectively breaks below $500 and tests $480, the pattern begins to materialize; if $480 also fails, $400 becomes the next reference level. These three tiers form a progressive risk map that helps adjust views on the sector at different stages.
2. Qualcomm's Fiscal 2027 $5 Billion Data Center Revenue Target and the Pace of Supply Improvement Are Subsequent Verification Points
Qualcomm's risk is concentrated on guidance delivery. According to CNBC, Amon said the data center business generated $650 million in revenue in the quarter and expects data center revenue to reach $5 billion in fiscal 2027. The target span from $650 million to $5 billion means the business needs to maintain high growth over the next several quarters, and any single-quarter slowdown could trigger a reassessment of the target's feasibility.
Another verification line is the pace of supply improvement. Amon attributes the current difficulties to supply issues rather than demand issues, and the test of this judgment is whether handset chip revenue can rebound quickly after supply conditions improve. If revenue remains under pressure after supply improves, demand-side factors may be underestimated, and management's explanatory framework will face revision. These two verification lines—delivery of the data center target and recovery of the handset business—together constitute the focus for Qualcomm's subsequent earnings reports.
3. If Rising Memory Costs Persist, the Negative Feedback Between Handset Prices and Demand May Extend to More Hardware Companies
The most contagious risk comes from the cost transmission chain. The CNBC report notes that rising memory costs push up handset prices and suppress demand, and this chain has already left a 26% year-over-year decline in Qualcomm's handset chip revenue. If rising memory costs persist, similar cost pressure may appear in other hardware categories that rely on memory.
The special nature of this risk line is its transmissibility. Memory is a common component in many electronic devices, and the impact of its price increase will not be limited to handsets alone. As cost pressure transmits from upstream to downstream, higher end prices suppress demand, and the demand contraction feeds back into upstream orders, forming a negative feedback loop. The duration and scope of this loop depend on the pace of change in the memory supply-demand landscape, and this variable has not yet been given clear data in the source and needs subsequent observation.
4. E.l.f. Beauty's Raised Full-Year Guidance Range Constitutes Its Subsequent Delivery Benchmark
The risk on the consumer side is relatively mild but still includes delivery pressure. E.l.f. Beauty's raised full-year guidance is net sales of $2.00–$2.03 billion and adjusted EPS of $3.82–$3.86. Raising guidance means the company has proactively raised its performance benchmark, and actual data in subsequent quarters needs to fall within or above this range to maintain market confidence in the growth narrative.
The other side of a guidance raise is a higher delivery threshold. If subsequent quarterly data fall at the low end of or below the range, the market's interpretation of this raise may shift from "management confidence" to "guidance too optimistic," putting pressure on valuation. Therefore, this range is not only a performance target but also an anchor for market sentiment, and its delivery will determine whether the consumer sector's strength can continue.
Final Thoughts
On November 4, 2026, the US stock market delivered two sets of earnings signals pointing in opposite directions. On the semiconductor side, the VanEck Semiconductor ETF formed a double top at $500 and is testing key support; accumulated put option positioning and put gamma dominance show sector sentiment shifting from chasing gains to defense; Qualcomm's current numbers beat with adjusted EPS of $2.17 and revenue of $10.32 billion, but handset chip revenue fell 26% year-over-year, total revenue fell 8%, and guidance was weak, with the stock down about 5% after hours, reinforcing cautious sentiment toward semiconductors. On the consumer side, E.l.f. Beauty provided strong evidence in the opposite direction with net sales up 51% year-over-year to $520.8 million, adjusted EPS of $1.21 far exceeding the expected 60 cents, and a full-year guidance raise to net sales of $2.00–$2.03 billion and adjusted EPS of $3.82–$3.86.
Putting these two sets of signals together does not yield a single conclusion of "the market is falling" or "the market is rising," but rather a picture of sector divergence. Semiconductor pressure stems from rising memory costs and supply constraints, a supply-side earnings visibility issue; consumer strength stems from resilient value demand, a demand-side earnings volume. Their drivers lie in different links of the economic chain, so their same-day appearance is not contradictory; rather, it may jointly indicate that capital is currently reallocating based on fundamental differences.
From a broader perspective, this divergence prompts us to watch signals at two levels. The first is the resonance of technicals and capital flows: the double top at $500 and put gamma dominance appearing simultaneously show that short-term risk in the semiconductor sector has received dual confirmation, and its subsequent evolution can be observed through the two reference levels of $480 and $400. The second is the direction of earnings guidance: during earnings season, guidance upgrades and downgrades determine capital migration paths more than the magnitude of current beats, and Qualcomm's weak guidance and E.l.f. Beauty's raised guidance are same-day samples of this rule.
The key variables for judging the subsequent direction are whether the semiconductor ETF's $500 support holds, whether Qualcomm's fiscal 2027 $5 billion data center revenue target and the pace of supply improvement can be delivered, and the persistence of memory cost transmission to end demand. The evolution of these variables will determine whether the current structural rotation is a short-term phenomenon or the beginning of a longer cycle.
Risk Disclosure: The macroeconomic environment and US stock market are highly volatile. This content is provided by MSX Research for academic and research observation reference only and does not constitute any investment advice.
Invest in AI RWA Finance
This article is produced by the MSXGO editorial team, AI-assisted, and reviewed through an editorial process. Fee rates and figures are subject to each platform's latest official announcements.
FAQ
What is the key support level for the semiconductor ETF, and where could it fall if breached? ▼
According to a Seeking Alpha analysis on November 4, 2026, the VanEck Semiconductor ETF is testing key support at $500, and a break below could lead to further declines toward $480 or even $400. This analysis is a single source and its methodology is not disclosed, so cross-validation is needed.
What does the put option positioning structure in the semiconductor sector indicate? ▼
According to the same Seeking Alpha analysis, accumulated put option positioning and put gamma dominance in the semiconductor sector, combined with the double top pattern at $500, indicate weakening sector sentiment and rising downside risk. Put gamma dominance means market makers' hedging behavior may amplify volatility during a decline.
Qualcomm's latest earnings beat expectations, so why did the stock fall after hours? ▼
According to a CNBC report on November 4, 2026, Qualcomm's fiscal Q4 2026 adjusted EPS of $2.17 and revenue of $10.32 billion were both above market expectations, but the company's guidance was weak and the stock fell about 5% after hours. The market's pricing focus has shifted from current numbers to next fiscal year's growth visibility.
What caused the decline in Qualcomm's handset chip revenue? ▼
According to CNBC, Qualcomm's handset chip quarterly sales fell 26% year-over-year to $5.14 billion, and total company revenue fell 8% year-over-year. The report attributes the main cause to rising memory costs pushing up handset prices and suppressing demand. Qualcomm CEO Amon said the current situation is a supply issue rather than a demand issue.
What were E.l.f. Beauty's latest quarterly results and full-year guidance? ▼
According to a CNBC report on November 4, 2026, E.l.f. Beauty's fiscal Q2 2027 net sales rose 51% year-over-year to $520.8 million, with adjusted EPS of $1.21, far exceeding the market expectation of 60 cents; the company raised full-year guidance to net sales of $2.00–$2.03 billion and adjusted EPS of $3.82–$3.86.
How should we understand semiconductor pressure and consumer stock strength appearing at the same time? ▼
Semiconductor sector pressure comes from rising memory costs and supply constraints, while consumer sector strength comes from resilient value demand; their drivers are different. The options structure with put gamma dominance is a sector-level capital phenomenon, which supports the judgment of sector rotation rather than a broad contraction in risk appetite, but this judgment still needs verification with capital flow data.
Finished reading? Ready to try trading?
Tokenized stocks/ETFs, crypto spot, and perpetual futures in one account — perp maker 0.02% / taker 0.045%, RWA spot buy 0.3% / sell 0.
Free sign-up · 3 quick steps