MSX US Stocks Daily Watch: S&P 500 Head and Shoulders vs. the 19-0 Post-Midterm Rule: SOXX Down Nearly 28% From Its High, SCHD and FDVV Defensive Dividend Comparison
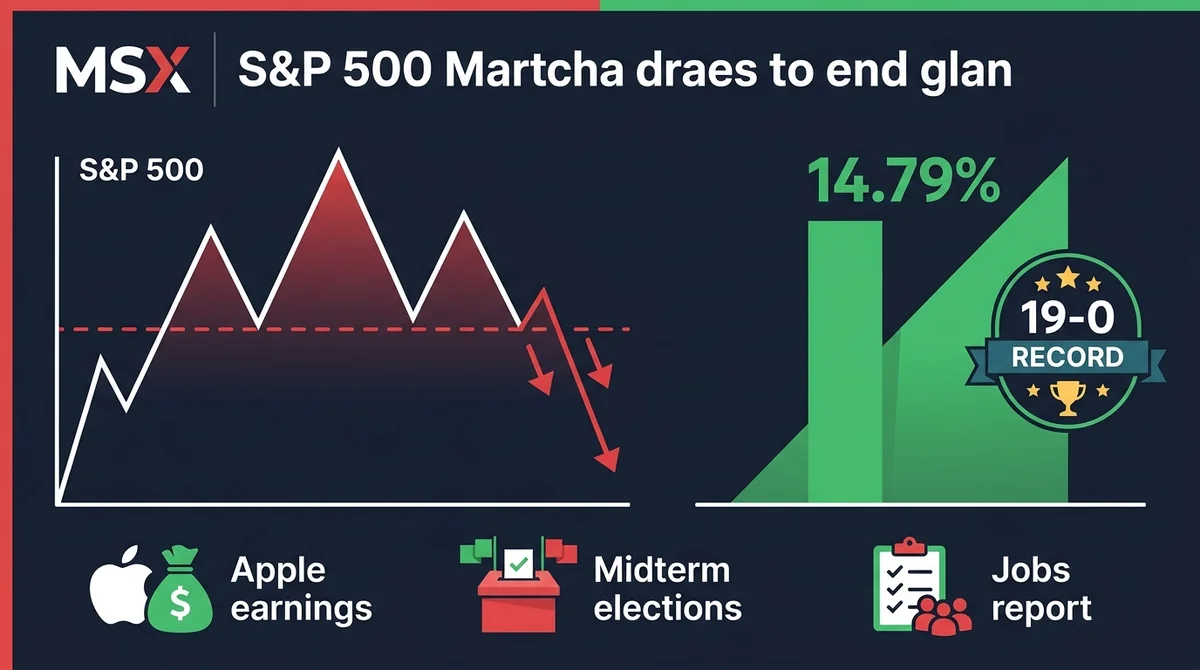
S&P 500 breaks key support, triggering a head and shoulders top while inside a post-midterm window that has never closed lower since 1950. SOXX is down nearly 28% from its June high.
Article Citation Summary
S&P 500 breaks key support, triggering a head and shoulders top while inside a post-midterm window that has never closed lower since 1950. SOXX is down nearly 28% from its June high.
MSX US Stocks Daily Watch: S&P 500 Head and Shoulders vs. the 19-0 Post-Midterm Rule: SOXX Down Nearly 28% From Its High, SCHD and FDVV Defensive Dividend Comparison
MSX Research
Guest Columnist
@MSX_CN
November 2026
This article is about 4,900 Chinese characters and takes about 12 minutes to read in full.
Technical analysis and statistical patterns are pointing in opposite directions within the same time window — the most noteworthy state of the current US stock market. According to an analysis published by Seeking Alpha on November 1, 2026, the S&P 500 broke below a key support level last Friday, triggering a bearish head and shoulders pattern. At the same time, the market sits inside the six-month post-midterm-election window — a window in which the S&P 500 has never closed lower since 1950, with an average gain of 14.79%. A bearish technical pattern and a bullish seasonal pattern are in direct confrontation. The direction will not be decided by the pattern itself, but more likely by the timing and combination of three major catalysts: Apple's earnings, the midterm elections, and the jobs report.
AI Summary
Core view: US stocks are currently in a standoff between bearish technicals and bullish seasonal statistics. Whether the head and shoulders pattern plays out depends on the market's reaction once the event catalysts land. The deep drawdown in the semiconductor chain shows that the AI trade is undergoing a repricing of growth sustainability, while defensive dividend vehicles have simultaneously received positive ratings — reflecting rising preference for cash flow and low beta in a high-volatility environment.
Key elements:
- The S&P 500 broke below a key support level last Friday, triggering a bearish head and shoulders pattern (source: Seeking Alpha, November 1, 2026).
- Since 1950, the S&P 500 has never closed lower in the six months following US midterm elections, with an average gain of 14.79% during that period (same source).
- The main upcoming catalysts listed by the same source include Apple's earnings, the midterm elections, and the jobs report.
- iShares Semiconductor ETF (SOXX) is down nearly 28% from its June high and fell 17% in October alone (source: Seeking Alpha, November 1, 2026).
- The author of that source reiterated a sell rating on SOXX, citing a confirmed bearish trend and decelerating semiconductor growth, and said technical signals suggest a recovery could take more than a year (analyst opinion).
- The same source said Intel's weak third-quarter results and deteriorating guidance intensified concerns about margin pressure and growth sustainability in the semiconductor industry.
- Schwab US Dividend Equity ETF (SCHD) was given a strong buy rating and seen as having defensive allocation value amid AI capex-driven volatility; its dividend compound annual growth rate is 10.83% and its beta is relatively low (source: Seeking Alpha, November 1, 2026).
- Fidelity High Dividend ETF (FDVV) was given a buy rating, suitable for long-term investors who want cautious tech exposure and higher historical dividend growth, but with greater valuation risk (same source).
1. S&P 500 Breaks Key Support and Triggers a Head and Shoulders Pattern; Technicals and Seasonal Patterns Both Come Into View
1. S&P 500 breaks below key support last Friday, triggering a bearish head and shoulders pattern
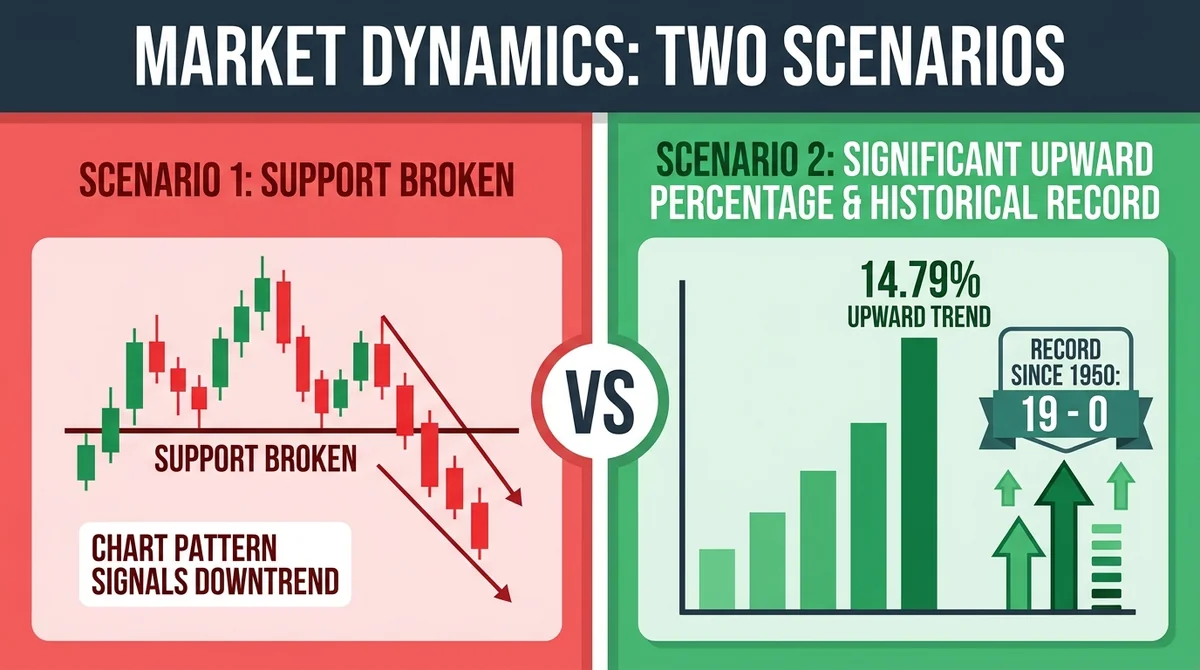
According to an analysis published by Seeking Alpha on November 1, 2026, the S&P 500 broke below a key support level last Friday, triggering a bearish head and shoulders pattern. The head and shoulders top is a widely tracked reversal pattern in technical analysis; once triggered, it means the index has structurally completed a shift from an uptrend to a potential downtrend. For funds tracking index-level signals, the loss of key support is usually more actionable than the pattern itself — it turns the debate over "whether the pattern holds" into an observation of "whether support can be quickly reclaimed."
It is important to stress the boundary of facts: the source confirms the event of breaking key support and triggering the pattern itself, but does not provide specific index levels, support values, or downside targets in sources verifiable for this article. Therefore, this article does not make numerical inferences about downside space and only records the technical state of the pattern being triggered.
2. Since 1950, the S&P 500 has never closed lower in the six months after midterm elections, with an average gain of 14.79%
Directly offsetting the bearish pattern is the seasonal statistic given by the same source: since 1950, the S&P 500 has never closed lower in the six months following US midterm elections, with an average gain of 14.79% during that period. This is exactly the statistical fact referred to by "19-0" in the title — a window rule unbroken across decades of samples (sample period and counting methodology are subject to the original text; this article has not independently recalculated them).
Why does this rule matter at the current juncture? Because it places the market under simultaneous pull from two narratives: technicals say the structure has already weakened, while statistics say the historical window has never failed. Neither is a forecast; both are conditional information. The technical pattern describes the current state of price structure, while the seasonal rule describes the frequency distribution of historical samples. The two coexist in the same time window and form the core tension of this judgment. For the market, this standoff itself may suppress willingness to make directional bets until one side is disproven by events.
2. Apple Earnings, Midterm Elections, and the Jobs Report Form the Three Near-Term Catalysts; Market Direction Depends on the Order in Which Events Land
1. Apple earnings, midterm elections, and the jobs report are listed as the main upcoming catalysts
According to the same source, the main upcoming catalysts listed in the article include Apple's earnings, the midterm elections, and the jobs report. These correspond respectively to heavyweight stock fundamentals, the political cycle, and the macro labor market — three main threads covering several of the more sensitive variables in index pricing.
The significance of these three catalysts clustering in the same time window is that they provide an external yardstick for testing the head and shoulders pattern. The realization of a technical pattern usually requires a fundamental trigger; if Apple's earnings or the jobs report deliver better-than-expected information, the pattern may be quickly invalidated. Conversely, if the index cannot reclaim key support after the events land, the technical meaning of the pattern will be reinforced. In other words, market direction depends to a large extent on the order and combination in which events land, not on the chart pattern itself.
2. The technical pressure of the head and shoulders top needs fundamental catalysts to validate or invalidate it
Before the catalysts land, the opposition between the technical pattern and the seasonal rule is difficult to disprove unilaterally. This is the point that most needs accurate description in the current market structure: it is not "which signal is stronger," but "which signal gets tested by events first."
From an analytical perspective, the reliability of a head and shoulders pattern depends heavily on volume and subsequent confirmation, while the reliability of seasonal statistics depends on the stability of out-of-sample extrapolation. Both are probabilistic tools and neither constitutes a promise about the future. A more prudent formulation is therefore: if the index reclaims key support after the catalysts land, the seasonal rule may regain dominance in the market narrative; if the catalysts fail to reverse the structure, the technical pressure of the head and shoulders top may further suppress risk appetite. This judgment is an inference, not an established fact.
3. SOXX Down Nearly 28% From Its June High and 17% in October Alone; Recovery in Semiconductors and the AI Trade Is Judged to Take More Than a Year
1. SOXX down nearly 28% from its June high, down 17% in October alone
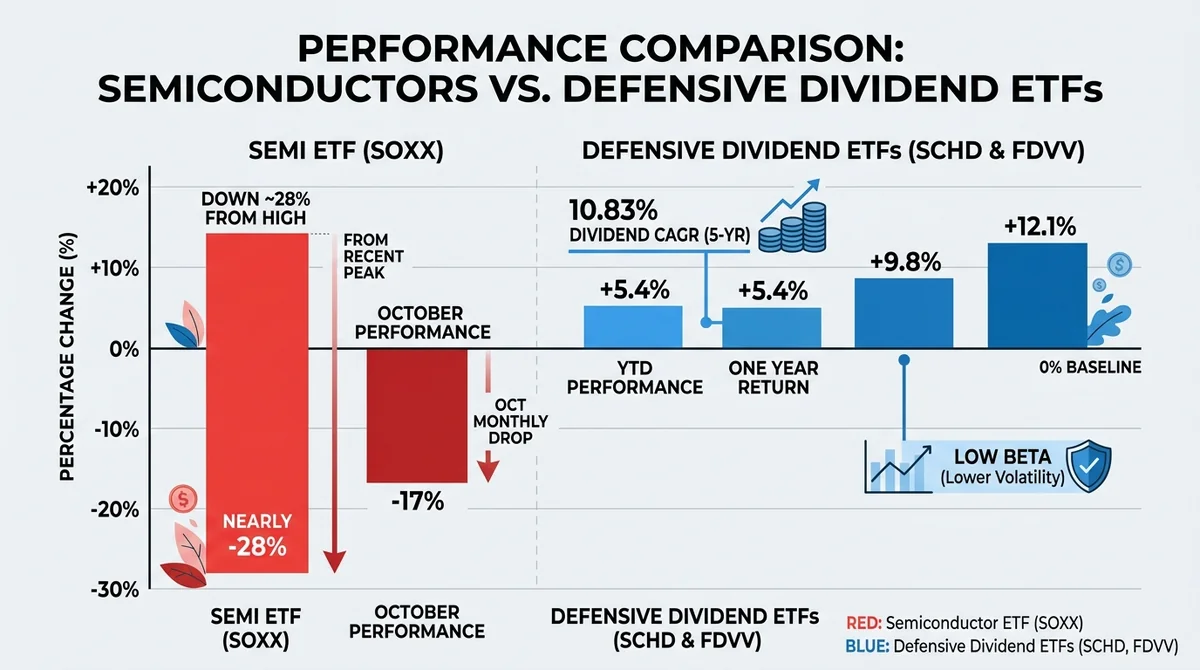
The scale of the semiconductor drawdown is the most direct gauge of current US equity risk appetite. According to an analysis published by Seeking Alpha on November 1, 2026, iShares Semiconductor ETF (SOXX) is down nearly 28% from its June high and fell 17% in October alone. A 17% monthly decline is significant for an index-level vehicle; it means the semiconductor correction is not merely an earnings problem for individual stocks, but closer to a valuation repricing across the entire supply chain (this is an inference).
Semiconductors are one of the core vehicles of the current AI capex narrative. The drawdown matters because it may map changes in how the market prices the sustainability of AI capex — when core assets carrying the narrative suffer a nearly 28% drawdown from their high, overall risk appetite for risk assets is usually dragged down in tandem, which may leave traces in the relative performance of defensive assets. Note that an ETF drawdown does not mean all constituent stocks fell by the same amount, nor does it mean AI capex has actually been revised down.
2. Sell rating reiterated: trend confirmed bearish, semiconductor growth decelerating, technical signals point to a recovery period of more than a year
The same source shows that the author reiterated a sell rating on SOXX, citing a confirmed bearish trend and decelerating semiconductor growth, and said technical signals suggest a recovery could take more than a year. This is the most time-oriented view in this round of judgment: it moves the discussion from "how much has it fallen" to "how long will recovery take."
"Recovery could take more than a year" is a subjective judgment by an analyst based on technical signals and should be treated as opinion rather than fact; moreover, a single analyst's sell rating does not constitute market consensus. But the question it raises is of general significance: when the trend is confirmed bearish and industry growth is confirmed decelerating, the time cost of mean reversion rises significantly. For the market, this means that even if the semiconductor chain rebounds, it is more likely to be interpreted as a technical repair rather than a trend reversal, until the decelerating-growth narrative is broken by new data.
3. Intel's weak third-quarter results and deteriorating guidance amplify concerns about industry margins and growth sustainability
Evidence on the fundamental side also points to pressure. According to the same source, Intel's weak third-quarter results and deteriorating guidance intensified market concerns about margin pressure and growth sustainability in the semiconductor industry. Weak results combined with deteriorating guidance usually carry more signal value than a single quarter's earnings miss — it may point to a downward revision of the earnings path for several quarters ahead (this is an inference; specific financial data should be based on Intel's official earnings reports, which this article has not verified item by item).
Putting Intel's fundamental signal together with SOXX's price signal yields a more complete picture: the nearly 28% price drawdown and the 17% October decline are being "confirmed" by adverse signals on the earnings side. This is precisely the core process the AI trade is undergoing — not a collapse of the demand narrative, but a repricing of growth sustainability. If guidance cuts continue in the subsequent earnings season, the repair cycle for the semiconductor chain may be further prolonged; if guidance stabilizes, the current deep drawdown may then translate into valuation appeal.
4. Defensive Dividend Comparison of SCHD and FDVV: One Rated Strong Buy, One Suited to Cautious Tech Exposure
1. SCHD rated strong buy, dividend compound annual growth rate of 10.83%, and relatively low beta
Against the backdrop of AI capex-driven volatility, the value of defensive allocation has been raised again. According to an analysis published by Seeking Alpha on November 1, 2026, Schwab US Dividend Equity ETF (SCHD) was given a strong buy rating and seen as having defensive allocation value amid AI capex-driven volatility; its dividend compound annual growth rate is 10.83%, and its beta is relatively low.
These three elements form the closed loop of SCHD's defensive logic: the strong buy rating represents the analyst's relative judgment, the 10.83% dividend compound annual growth rate represents the historical record of cash flow growth (a historical value, not indicative of future growth), and the lower beta represents lower sensitivity to market volatility. Against the combination of a deep semiconductor drawdown and weakening index technicals, the mix of low beta and stable dividend growth precisely corresponds to a possible path of capital migrating from high-volatility assets to cash-flow assets (this is an inference; capital flows are not quantified in the sources for this article).
2. FDVV rated buy, suitable for long-term investors seeking cautious tech exposure and higher historical dividend growth, but with greater valuation risk
The other end of the comparison is Fidelity High Dividend ETF (FDVV). The same source shows that FDVV was given a buy rating, suitable for long-term investors who want cautious tech exposure and higher historical dividend growth, but with greater valuation risk.
The difference between the two should not be simplified into a ranking of better or worse, but understood as a trade-off between defensive purity and the degree of retained tech exposure. SCHD's positioning is closer to pure defense — low beta and stable dividend compound growth; FDVV's positioning is to pursue higher historical dividend growth while retaining some tech exposure, at the cost of greater valuation risk. In an environment of semiconductor drawdown and a repriced AI trade, the practical meaning of this trade-off is: the former is closer to the goal of "reducing volatility," while the latter is closer to the goal of "not fully giving up tech participation." The rating difference (strong buy versus buy) itself also reflects the analyst's weighting of valuation risk.
Final Thoughts
Looking at the four threads together, the core feature of the current US stock market is confrontation rather than one-sidedness. Technicals (head and shoulders top) and seasonal statistics (no lower close in the six months after midterm elections since 1950, average gain of 14.79%) give opposite signals, and event catalysts become the arbiter of direction; the order in which Apple's earnings, the midterm elections, and the jobs report land may determine which narrative dominates in the near term.
The second thread is the repricing of the AI trade. The deep drawdown in the semiconductor chain (SOXX down nearly 28% from its June high and 17% in October alone) and Intel's weak guidance appearing at the same time show that the market is shifting its pricing focus from the "demand narrative" to "growth sustainability." This process does not necessarily mean the end of the AI capex cycle, but it does raise the time cost of repair — the sell-side judgment that recovery could take more than a year is exactly an expression of this time dimension.
The third thread is the migration of capital preference. Defensive dividend vehicles (SCHD, FDVV) have simultaneously received positive ratings, which may reflect rising preference for cash flow and low beta in a high-volatility environment. SCHD's 10.83% dividend compound annual growth rate and lower beta, versus FDVV's retained tech exposure but greater valuation risk, constitute two solutions to the same defensive need.
Risks and opportunities coexist: if the head and shoulders top is invalidated by catalysts, the seasonal rule may regain dominance; if confirmed, the relative advantage of defensive allocation may become more evident. At this stage, direction is decided by catalysts, while relative strength is decided by cash flow quality.
Risk disclosure: Macroeconomic and US equity market volatility is severe. This content is provided by MSX Research for academic and research observation reference only and does not constitute any investment advice.
Invest in AI RWA Finance
This article is produced by the MSXGO editorial team, AI-assisted, and reviewed through an editorial process. Fee rates and figures are subject to each platform's latest official announcements.
FAQ
What does the S&P 500 head and shoulders pattern mean? ▼
According to a Seeking Alpha analysis dated November 1, 2026, the S&P 500 broke below a key support level last Friday, triggering a bearish head and shoulders pattern, meaning the index has structurally completed a shift from an uptrend to a potential downtrend; the source did not provide specific levels or downside targets.
What is the historical pattern for the S&P 500 after midterm elections? ▼
According to the same source, since 1950 the S&P 500 has never closed lower in the six months following US midterm elections, with an average gain of 14.79% during that period; this is a historical statistic, not a forecast.
How much has the SOXX semiconductor ETF pulled back recently? ▼
According to a Seeking Alpha analysis dated November 1, 2026, iShares Semiconductor ETF (SOXX) is down nearly 28% from its June high and fell 17% in October alone.
Why did the analyst give SOXX a sell rating? ▼
The author of that source reiterated a sell rating on SOXX, citing a confirmed bearish trend and decelerating semiconductor growth, and said technical signals suggest a recovery could take more than a year; this is analyst opinion and does not constitute market consensus.
How do the ratings and positioning of SCHD and FDVV differ? ▼
SCHD was given a strong buy rating, with a dividend compound annual growth rate of 10.83% and relatively low beta; FDVV was given a buy rating, suitable for long-term investors seeking cautious tech exposure and higher historical dividend growth, but with greater valuation risk.
What impact did Intel's third-quarter results have on the semiconductor industry? ▼
According to the same source, Intel's weak third-quarter results and deteriorating guidance intensified market concerns about margin pressure and growth sustainability in the semiconductor industry; specific financial data should be based on Intel's official earnings reports.
Finished reading? Ready to try trading?
Tokenized stocks/ETFs, crypto spot, and perpetual futures in one account — perp maker 0.02% / taker 0.045%, RWA spot buy 0.3% / sell 0.
Free sign-up · 3 quick steps