MSX US Stocks Daily Watch: S&P 500 Technical Inflection and the AI Packaging Chain: Amkor Secures ~$3B Nvidia Commitment but Slumps on Weak Guidance; Meta Weighed Down by $9.89B Litigation Charge
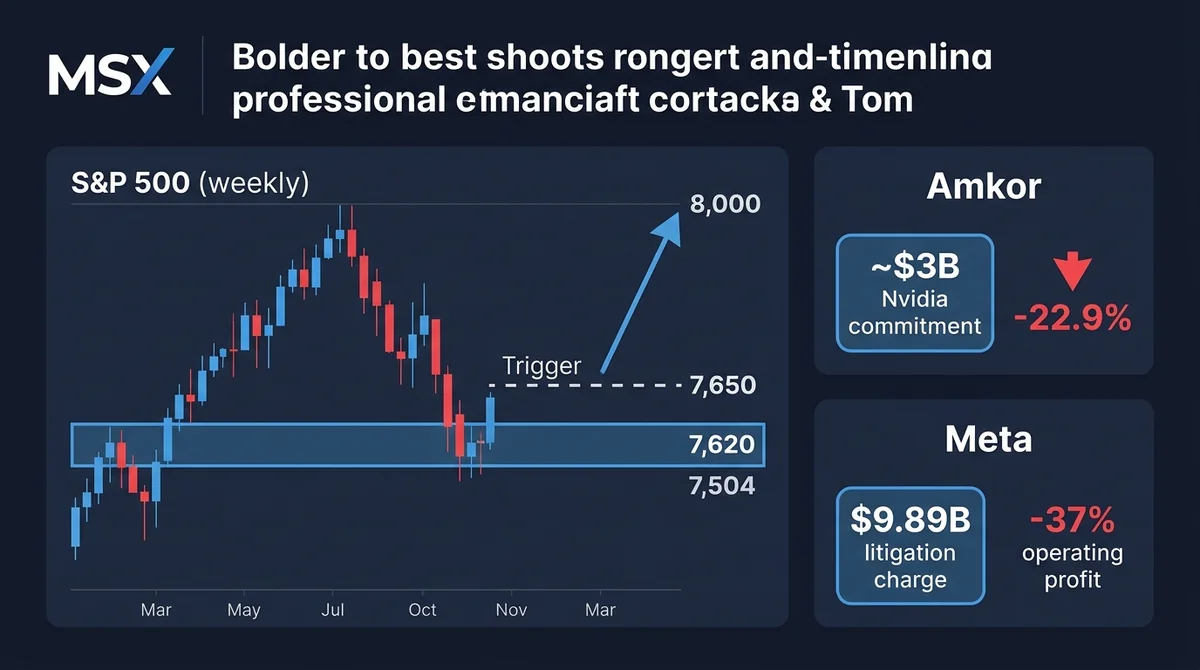
Oct 2026 US stocks: S&P 500 at 7,620/7,504 support inflection, weekly close above 7,650 as rebound trigger; Amkor wins ~$3B Nvidia packaging pledge but Q3 guidance misses, shares fell 22.9%; Meta operating profit down 37% on $9.89B litigation charge.
Article Citation Summary
Oct 2026 US stocks: S&P 500 at 7,620/7,504 support inflection, weekly close above 7,650 as rebound trigger; Amkor wins ~$3B Nvidia packaging pledge but Q3 guidance misses, shares fell 22.9%; Meta operating profit down 37% on $9.89B litigation charge.
MSX US Stocks Daily Watch: S&P 500 Technical Inflection and the AI Packaging Chain: Amkor Secures ~$3B Nvidia Commitment but Slumps on Weak Guidance; Meta Weighed Down by $9.89B Litigation Charge
MSX Research
Special Guest Columnist
@MSX_CN
October 2026
The long-term direction of AI capital expenditure remains intact, but the way the market prices it may be changing: total order volume is no longer the sole anchor, and the pace of delivery and profit quality are now being factored into valuation. This judgment emerged simultaneously from two earnings reports and one S&P 500 weekly chart in late October 2026—according to Seeking Alpha analysis, Nvidia locked in Amkor's advanced packaging capacity with a multi-year commitment of approximately $3 billion, yet Amkor's shares plunged as much as 22.9% in a single day after its Q3 revenue guidance fell short of market expectations; Meta's advertising and AI monetization was described as still strong, but a $9.89 billion litigation charge dragged operating profit down 37% year-over-year. Meanwhile, the S&P 500 is standing above a technical support band formed by 7,620 and 7,504, and whether the weekly chart can close above 7,650 is seen as the dividing line between a November move toward a new high near 8,000 or a repeat of the late-2018 selloff script. All figures below are from the aforementioned third-party analysis; specific definitions are subject to the companies' official financial reports and announcements.
AI Summary
Core View: US equity signals in late October 2026 show that the AI capital expenditure cycle is still ongoing, but the market may be shifting from narrative pricing of "who gets the orders" to delivery-based pricing of "when orders convert into profits"; the S&P 500's technical inflection and individual stock earnings divergence are appearing at the same time, meaning index positioning and individual stock fundamentals need to be assessed separately.
Key Elements:
- According to Seeking Alpha technical analysis, the S&P 500 index is at a technical inflection point, with key support levels at 7,620 and 7,504; if the weekly chart closes above 7,650, it could trigger a November rebound targeting a new high near 8,000; if the weekly chart closes below 7,600, the analysis believes it would increase the risk of a selloff similar to late 2018.
- According to the same source, on October 21, 2026, Amkor announced a $1.3 billion agreement with Nvidia to expand advanced packaging capacity in South Korea.
- Combined with the $1.5 billion Arizona agreement signed in July, Amkor's multi-year commitments to Nvidia total approximately $3 billion, of which the two announced deals totaling $2.8 billion constitute a confirmed floor.
- Amkor's Q3 revenue guidance was $1.95–2.05 billion, below market expectations of approximately $2.12 billion, and the stock fell as much as 22.9% the next day.
- Meta's Q3 operating profit fell 37% year-over-year, mainly due to a $9.89 billion litigation charge, and the stock fell about 10% after earnings.
- The analysis states that Meta's advertising revenue remains strong, driven by AI monetization, with significant growth in advertising revenue per DAP; its AI product Muse grew users rapidly in less than six weeks. These statements are third-party descriptions; specific metrics await company disclosure for verification.
1. The S&P 500 Is at a Technical Inflection: 7,620 and 7,504 Form a Support Band the Bulls Must Hold
1. Weekly 7,650 Becomes the Trigger for the November Rebound, with Upside Target Near a New High of 8,000
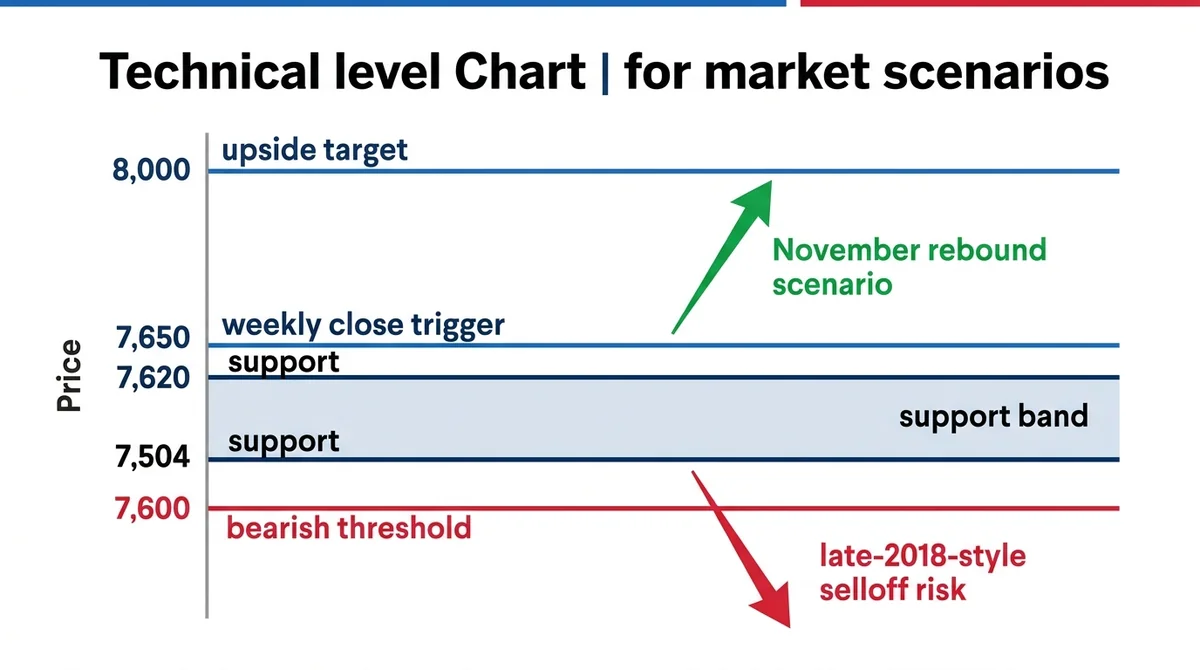
As of late October 2026, the S&P 500's position is itself a watershed. According to technical analysis published by Seeking Alpha on October 25, 2026, the index is currently at a technical inflection point, with key support levels at 7,620 and 7,504, and whether the weekly chart can close above 7,650 is the first threshold for judging the nature of the November market. The analysis notes that if the weekly chart closes above 7,650, it could trigger a November rebound, with an upside target near a new high of 8,000.
The significance of these numbers is not a prediction accurate to the single digit, but that they convert "directional judgment" into "positional judgment." 7,620 and 7,504 form a support band, 7,650 is the rebound trigger line, and the narrow range between them means the index has not yet made a choice. For capital that observes on a weekly basis, before the trigger line is effectively broken, any upward assumption is only a possibility, not a conclusion.
2. If the Weekly Chart Closes Below 7,600, the Technical Setup Shifts to Downside Risk Similar to Late 2018
The same analysis provides a symmetric downside scenario: if the S&P 500 weekly chart closes below 7,600, it would constitute a worrying technical shift, increasing the risk of a selloff similar to late 2018. The value of this analogy is that the late-2018 selloff was not triggered by a single fundamental event, but by a chain reaction of passive risk-budget contraction after a technical breakdown. In other words, below 7,600 is not just a price level, but more likely a switch that changes capital behavior.
Placing the upside and downside scenarios side by side reveals the core characteristic of the current index position: bulls must hold the support band formed by 7,620 and 7,504 to even qualify to discuss a new high near 8,000; once the weekly chart loses 7,600, the focus of discussion shifts from "rebound target" to "downside risk." This asymmetric payoff structure is precisely the definition of a technical inflection. It should be noted that the above levels and scenarios come from a single third-party technical analysis and are conditional projections, not deterministic forecasts.
2. Amkor Secures ~$3 Billion Multi-Year Commitment from Nvidia, Making Advanced Packaging a Certain Link in the AI Compute Chain
1. The $1.3 Billion Korea Expansion Agreement Plus the $1.5 Billion Arizona Project: The Two Deals Totaling $2.8 Billion Constitute a Confirmed Floor
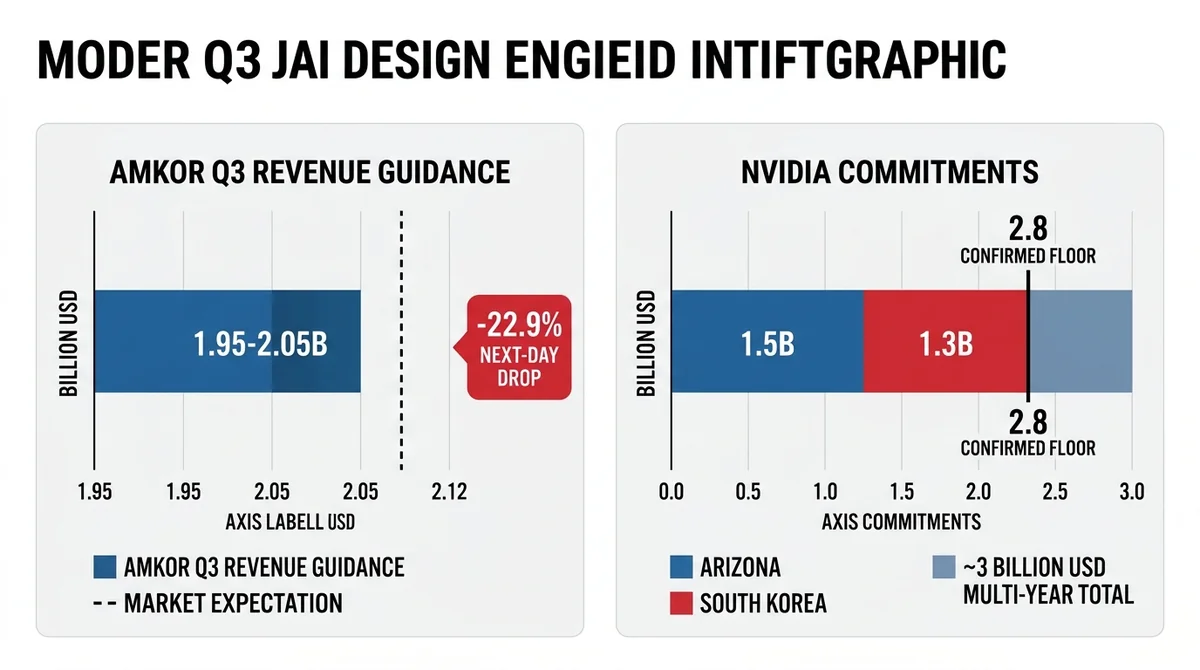
According to Seeking Alpha analysis, on October 21, 2026, Amkor announced a $1.3 billion agreement with Nvidia to expand advanced packaging capacity in South Korea. Combined with the $1.5 billion Arizona agreement signed in July, Amkor's multi-year commitments to Nvidia total approximately $3 billion, of which the two announced deals totaling $2.8 billion constitute a confirmed floor. The layers of these figures need to be distinguished: approximately $3 billion is the total multi-year commitment, and $2.8 billion is the sum of the two announced agreements, constituting a traceable confirmed floor.
From an industry-chain perspective, the two agreements are located in South Korea and Arizona, covering two advanced packaging capacity nodes in Asia and North America. For a packaging and testing company, capacity commitments from a single customer spanning multiple years and regions mean far more than a single order—it means the customer is willing to lock in capacity with long-term capital expenditure rather than purchasing quarter by quarter on the spot market.
2. Capital Commitments for AI Packaging Capacity Show the Compute Bottleneck Is Spilling Over from Process to Packaging
Nvidia's multi-year commitment to lock in Amkor's packaging capacity reflects the strategic position of advanced packaging in the AI supply chain. As the marginal returns from process scaling diminish, chip performance gains increasingly depend on interconnect density and integration capabilities in packaging, turning packaging from a back-end process into a precondition for unlocking compute. Nvidia's willingness to pay for certainty of compute supply with a multi-year commitment of approximately $3 billion is essentially paying for supply certainty.
This also explains why advanced packaging has become one of the more certain links in the AI compute chain: capital expenditure at process nodes is dominated by a few wafer fabs, while packaging capacity expansion also requires long-cycle investment; once customers lock in with multi-year agreements, capacity visibility improves significantly. For other participants in the supply chain, Amkor's two agreements provide an observational sample—AI capital expenditure is spilling over from wafer manufacturing to back-end links such as packaging and testing.
3. Order Commitments Diverge from Current Guidance: Amkor's Q3 Guidance Miss Triggers a Single-Day Plunge of as Much as 22.9%
1. Revenue Guidance of $1.95–2.05 Billion Below Market Expectations of Approximately $2.12 Billion
In sharp contrast to the multi-year commitments is Amkor's guidance for current performance. According to Seeking Alpha analysis, the company's Q3 revenue guidance was $1.95–2.05 billion, below market expectations of approximately $2.12 billion, and the stock fell as much as 22.9% the next day after the guidance was released. This is a typical expectation-gap shock: it is not a directional reversal in the company's fundamentals, but a gap of approximately $70–170 million between current guidance and market consensus, and that gap was enough to wipe more than 20% off the stock's market value in a single day.
It should be emphasized that the approximately $3 billion multi-year commitment is a medium- to long-term framework, on a completely different time dimension from quarterly revenue guidance. Multi-year agreements lock in certainty of capacity and cooperation, while quarterly guidance reflects the reality of current capacity ramp-up, customer pull-in pace, and product mix. The two are not contradictory, but the market clearly weighted the latter when pricing.
2. Multi-Year Capacity Commitments Cannot Offset Short-Term Earnings Gaps; AI Packaging Chain Valuation Begins to Distinguish "Order Narrative" from "Delivery Pace"
Amkor's case shows that multi-year capacity commitments cannot offset short-term earnings gaps. When a company simultaneously carries the labels of "approximately $3 billion multi-year commitment" and "Q3 guidance below expectations," the market chooses to trade the latter first, because guidance is verifiable in the current period, while the delivery of multi-year commitments requires crossing multiple quarters. This shift in pricing order may signal that the valuation logic for AI supply chain companies is moving from total order volume to the pace of order delivery.
For the AI packaging chain, this may be a phased signal: in the first stage, the market pays a premium for "winning orders"; in the second stage, the market begins to ask "when orders convert into revenue and profit." Amkor's single-day drop of as much as 22.9% is precisely a manifestation of second-stage pricing. If revenue in subsequent quarters returns to the market's expected trajectory, the value of the multi-year commitments may be re-incorporated; if the delivery pace continues to fall short, the order narrative itself will also be discounted.
4. Meta's Operating Profit Falls 37% Year-over-Year: $9.89 Billion Litigation Charge and a Sharp Q4 Capex Jump Both Weigh
1. One-Time Litigation Charge Pressures GAAP Profit; Stock Falls About 10% After Earnings
According to Seeking Alpha analysis, Meta's Q3 operating profit fell 37% year-over-year, mainly due to a $9.89 billion litigation charge, and the stock fell about 10% after earnings. This is a typical non-recurring item shock: the $9.89 billion litigation charge was directly recorded in GAAP profit, pulling operating profit growth to -37% year-over-year. For investors who use GAAP profit as a valuation anchor, the impact of this figure is immediate, and the roughly 10% stock decline is the market's immediate pricing of it.
However, one-time charges need to be distinguished from operating profitability. Litigation charges are non-recurring items that change the current income statement, not the unit economics of the advertising business. The roughly 10% post-earnings decline reflects more of an instinctive reaction to income statement volatility than a rejection of Meta's advertising business itself.
2. Advertising Revenue and AI Monetization Remain Strong; Rapid User Growth of Muse Constitutes the Other Side of Fundamentals
Parallel to the income statement shock is the other side of fundamentals. According to Seeking Alpha analysis, Meta's advertising revenue remains strong, driven by AI monetization, with significant growth in advertising revenue per DAP; its AI product Muse grew users rapidly in less than six weeks. This description indicates that Meta's core cash cow business has not been damaged by the litigation charge, and AI monetization may even be becoming an incremental source of advertising revenue, but the specific values of the relevant metrics have not been provided in this article's sources and are subject to company disclosure.
Meanwhile, the analysis states that Meta's Q4 capital expenditure will jump sharply. This statement is logically homologous to Amkor's multi-year packaging commitment: both are part of the AI investment cycle, with the only difference being that Amkor is the party receiving investment and Meta is the party spending it. When a sharp capex jump and a one-time litigation charge appear in the same earnings report, the market's pricing of Meta will include both "increased investment" and "profit pressure," which is one of the possible backgrounds for the roughly 10% post-earnings decline.
5. Both Main Threads Point to the Same Thing: Pricing of AI Capital Expenditure Is Shifting from Volume to Delivery Quality
1. Amkor's Guidance Gap and Meta's Cost and Capex Pressure Are Two Presentations of the Same AI Investment Cycle
Looking at Amkor and Meta together, they describe two sides of the same AI investment cycle. Amkor securing Nvidia's approximately $3 billion multi-year packaging commitment represents capacity in the compute supply chain being locked in for the long term; Meta's sharp Q4 capex jump represents the demand side still increasing investment. Together they support the judgment that the AI capital expenditure cycle is still ongoing.
But the post-earnings stock reactions of the two companies are equally worth juxtaposing: Amkor fell as much as 22.9% in a single day due to Q3 guidance below expectations, while Meta fell about 10% after earnings due to a $9.89 billion litigation charge that dragged operating profit down 37% year-over-year. One is a gap in the pace of order delivery, the other is dual pressure from costs and capex; the forms differ, but the direction is the same—the market may be starting to price the delivery quality of investment rather than simply paying for the total volume of investment.
2. Index Technical Inflection Combined with Individual Stock Earnings Divergence Means Position Structure Matters More Than Directional Judgment
The S&P 500's technical inflection above the 7,620 and 7,504 support band and below the 7,650 weekly trigger line coincides with the earnings divergence of Amkor and Meta. Directional judgment at the index level cannot cover delivery risk at the individual stock level: even if the index eventually breaks upward, individual companies may still see double-digit declines due to quarterly guidance or one-time charges; even if the index breaks downward, links with long-term capacity commitments may remain relatively resilient.
Therefore, the core contradiction in the current market environment may not be "bullish or bearish," but "whether the position structure matches the delivery pace." Investors' focus is shifting from "who gets the orders" to "when orders convert into profits," and this shift may simultaneously affect structural divergence within the index and valuation differences among individual stocks. Before the technical inflection is confirmed by the weekly chart, position structure is more important than directional judgment.
Final Thoughts
The S&P 500 is at a technical inflection between the 7,620 and 7,504 support band and the 7,650 weekly trigger line, with direction not yet confirmed. The special nature of this position is that both upside and downside scenarios have clear technical conditions: a weekly close above 7,650 could trigger a November rebound targeting a new high near 8,000; a weekly close below 7,600 increases the risk of a selloff similar to late 2018. The index itself has not provided an answer; it has simply handed the choice to the weekly close.
Nvidia's approximately $3 billion multi-year packaging commitment to Amkor confirms the long-term position of advanced packaging in the AI supply chain. The $1.3 billion Korea agreement and the $1.5 billion Arizona agreement total $2.8 billion, constituting a traceable confirmed floor. This indicates that the bottleneck in the AI compute chain may be spilling over from process to packaging, thereby improving capacity visibility in the packaging link.
However, Amkor's Q3 revenue guidance of $1.95–2.05 billion fell below market expectations of approximately $2.12 billion, and the stock fell as much as 22.9% the next day, signaling a time lag between order commitments and earnings delivery. Meta's operating profit fell 37% year-over-year due to a $9.89 billion litigation charge, while facing a sharp Q4 capex jump, showing the other side of the same coin from the demand side.
Taken together, the pricing focus of the AI capital expenditure cycle may be shifting from total order volume to delivery pace and profit quality. The long-term direction is unchanged, but the pricing method has changed; index positioning and individual stock fundamentals need to be assessed separately, which is precisely the signal worth watching in US stocks in late October 2026.
Risk Warning: Macroeconomic and US equity market volatility is severe. This content is for the academic and research observation reference of MSX Research only and does not constitute any investment advice.
This article is produced by the MSXGO editorial team, AI-assisted, and reviewed through an editorial process. Fee rates and figures are subject to each platform's latest official announcements.
FAQ
What are the S&P 500's current key support levels and rebound trigger line? ▼
According to technical analysis published by Seeking Alpha on October 25, 2026, the S&P 500 index is at a technical inflection point, with key support levels at 7,620 and 7,504; if the weekly chart closes above 7,650, it could trigger a November rebound targeting a new high near 8,000. These levels are third-party conditional projections, not deterministic forecasts.
What is the total value of Amkor's multi-year packaging commitment with Nvidia? ▼
According to Seeking Alpha analysis, on October 21, 2026, Amkor announced a $1.3 billion agreement with Nvidia to expand advanced packaging capacity in South Korea; combined with the $1.5 billion Arizona agreement signed in July, the multi-year commitments total approximately $3 billion, of which the two announced deals totaling $2.8 billion constitute a confirmed floor.
Why did Amkor's stock plunge as much as 22.9% after announcing Q3 guidance? ▼
According to Seeking Alpha analysis, Amkor's Q3 revenue guidance was $1.95–2.05 billion, below market expectations of approximately $2.12 billion, and the stock fell as much as 22.9% the next day after the guidance was released. Specific declines and expectation figures are subject to company announcements and market data.
Why did Meta's Q3 operating profit fall 37% year-over-year? ▼
According to Seeking Alpha analysis, Meta's Q3 operating profit fell 37% year-over-year, mainly due to a $9.89 billion litigation charge, and the stock fell about 10% after earnings. This charge is a non-recurring item; specific amounts are subject to the company's financial reports.
How are Meta's advertising business and AI product Muse performing? ▼
According to Seeking Alpha, Meta's advertising revenue remains strong, driven by AI monetization, with significant growth in advertising revenue per DAP; its AI product Muse grew users rapidly in less than six weeks. The above are third-party qualitative descriptions; specific metric values await company disclosure for verification.
What risk would a weekly close below 7,600 for the S&P 500 bring? ▼
The analysis notes that if the S&P 500 weekly chart closes below 7,600, it would constitute a worrying technical shift, increasing the risk of a selloff similar to late 2018. This is a conditional scenario projection and does not represent a necessary outcome.
Finished reading? Ready to try trading?
Tokenized stocks/ETFs, crypto spot, and perpetual futures in one account — perp maker 0.02% / taker 0.045%, RWA spot buy 0.3% / sell 0.
Free sign-up · 3 quick steps