MSX US Stock Daily Watch: Colgate, GPIX and Meta — Colgate's Gross Margin Hits Record 61.5% but P/E Ratio Tops 10-Year Average; Meta's Muse AI Eases AI Capex Concerns
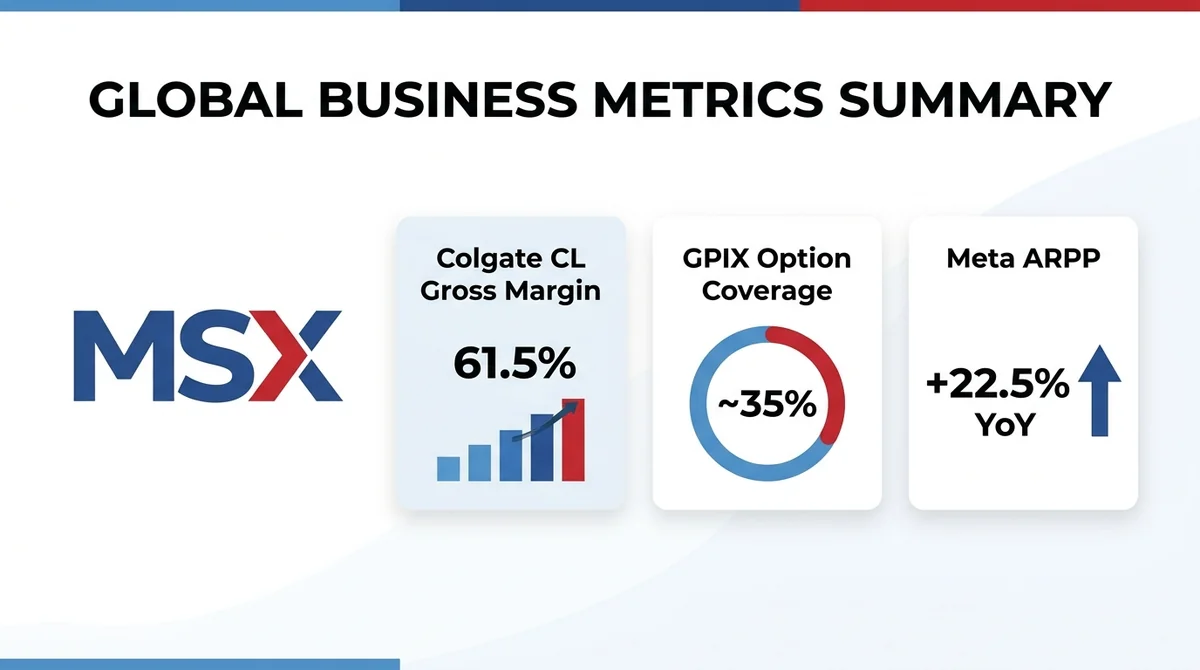
Colgate's gross margin hits a record 61.5%, but its adjusted P/E ratio of ~26x exceeds the 10-year average of 24x; GPIX uses ~35% option coverage for price upside; Meta's Muse AI eases capex worries.
Article Citation Summary
Colgate's gross margin hits a record 61.5%, but its adjusted P/E ratio of ~26x exceeds the 10-year average of 24x; GPIX uses ~35% option coverage for price upside; Meta's Muse AI eases capex worries.
US Stock Watch: Colgate, GPIX and Meta — Colgate's Gross Margin Hits a Record 61.5% but Its P/E Ratio Tops the 10-Year Average, While Meta's Muse AI Eases AI Capex Concerns
MSX Research | Guest Columnist @MSX_CN | October 2026
On the same day, a toothpaste company's gross margin was described by an analysis piece as hitting a record 61.5%, an option-income ETF traded a lower coverage ratio for net asset value (NAV) upside, and a large tech company used AI product adoption data to answer questions about its capital expenditure. The following content is drawn from three Seeking Alpha analysis articles published on October 22, 2026 (see links at the end). These represent the views of third-party authors, not official company disclosures; this article relays and interprets them and does not independently verify the figures involved.
AI Summary
Core view: According to Seeking Alpha analysis, Colgate's record gross margin and its above-10-year-average P/E ratio appear simultaneously, GPIX trades an option coverage ratio of roughly 35% for stronger price appreciation potential, and Meta's Muse AI adoption is seen as easing AI capex concerns. The original authors place these three threads within a single framework: capital is repricing "certainty." This framework is the interpretation of the original authors and this editor, not a directly verifiable fact.
Key elements:
- According to Seeking Alpha's October 22, 2026 analysis, Colgate-Palmolive (CL) gross margin reached 61.5%, which the analysis calls a record level, and states that fundamentals have recovered with volume growth, benefiting from emerging markets.
- The same analysis states that Colgate's adjusted P/E ratio is about 26x, above its 10-year average of 24x, and that its dividend yield is below its long-term norm.
- According to Seeking Alpha's comparative analysis the same day, the Goldman Sachs S&P 500 Premium Income ETF (GPIX) has an option coverage ratio of about 35%, lower than SPYI, and performs better on price appreciation.
- The analysis states that both GPIX and SPYI achieve tax efficiency through return of capital, but neither provides downside protection.
- According to Seeking Alpha's analysis the same day, Meta Platforms' third-quarter Family ARPP (average revenue per user) grew 22.5% year over year, with ad prices accelerating upward, but user growth slowing.
- The same analysis states that Meta was reiterated as a "Strong Buy" on the back of strong Muse AI adoption and attractive valuation after a recent share price decline; it also flags high capital expenditure and negative free cash flow as concerns.
1. Colgate's Gross Margin Hits a Record 61.5%: Fundamental Recovery and Valuation Premium Coexist
1. Colgate's Gross Margin Rises to 61.5%, Supported by Both Volume Growth and Emerging Markets
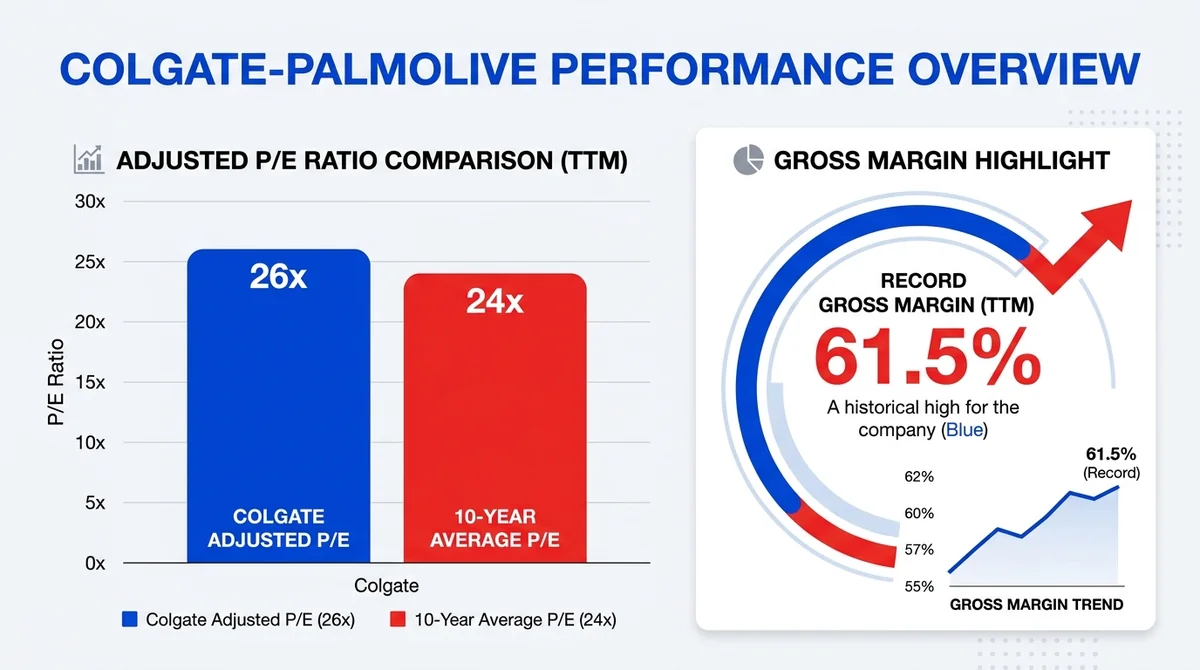
According to an analysis published by Seeking Alpha on October 22, 2026, Colgate-Palmolive (CL) gross margin reached 61.5%, which the analysis calls a record level, and states that the company's fundamentals have recovered with volume growth while benefiting from emerging markets. Note that the 61.5% figure and the "record" characterization are both statements from this third-party analysis; this article has not independently verified them against company filings or official announcements.
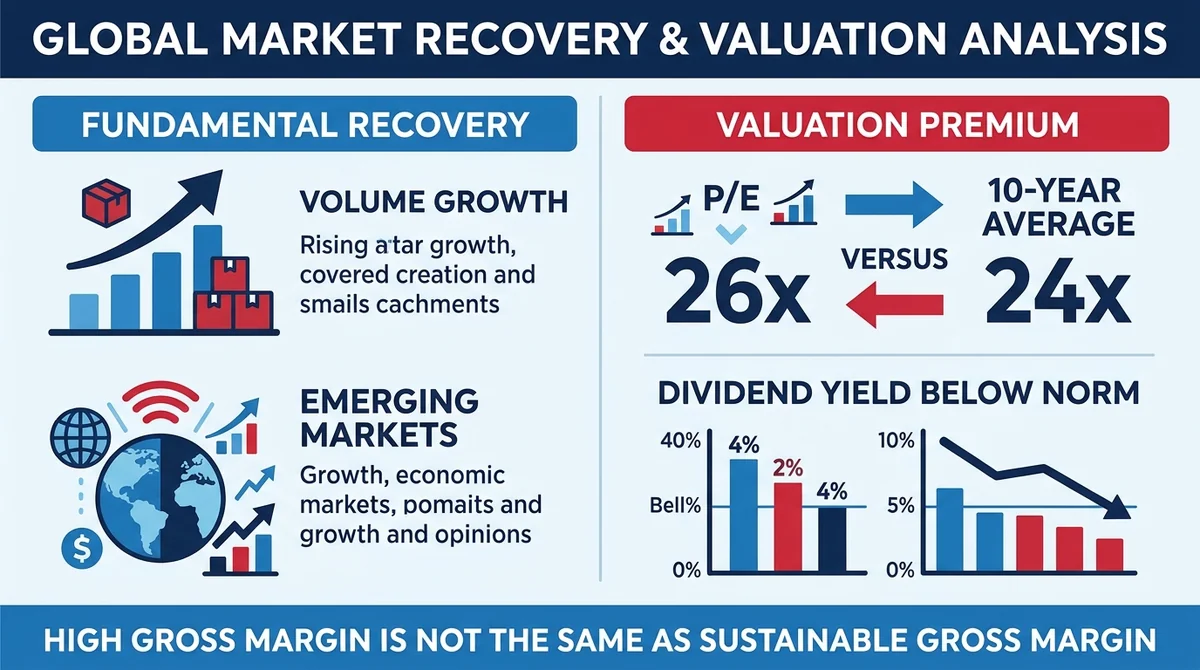
For consumer staples companies, gross margin expansion typically comes from product mix upgrades, supply chain efficiency improvements and regional portfolio optimization. If the volume growth and emerging market exposure described in the analysis hold, the 61.5% gross margin has a plausible sustainability narrative; but "high gross margin" and "sustainable gross margin" are two different propositions, and the latter requires validation from subsequent quarterly data.
2. Adjusted P/E Ratio of About 26x Tops 10-Year Average of 24x, Dividend Yield Below Long-Term Norm
Contrasting with the gross margin is the valuation side. The same analysis states that Colgate's current adjusted P/E ratio is about 26x, above its 10-year average of 24x, while its dividend yield is below its long-term norm. Taken together, these two signals paint a picture of "defensive assets being repriced": when the share price rises faster than earnings growth, the P/E ratio is passively pushed up; when the share price rises faster than dividend increases, the dividend yield is passively compressed.
For investors whose core demand is dividends and stability, this is a change that needs to be confronted: the same capital now buys back a smaller proportion of cash return. In other words, the premium paid at a 26x P/E ratio no longer buys "high dividends" but "certainty of earnings quality and volume recovery." This distinction matters — whether the valuation holds depends on whether volume and emerging market growth continue to materialize, not merely on interest rates or dividend preferences.
3. After Outperforming the Nasdaq by 7 Percentage Points in a Single Day, the Pricing Logic of Defensive Assets Needs Re-examination
According to the same analysis, Colgate outperformed the Nasdaq by about 7 percentage points in a single trading day. For a low-beta consumer staples stock, such single-day relative performance is unusual and may reflect increased preference for certain cash flows on a particular trading day. But note: single-day relative performance is a single data point and cannot be directly extrapolated into a trend or a structural shift in capital flows; it may also relate to that day's index composition, stock-specific news or liquidity factors.
Stringing the three pieces together: Colgate is currently described as having both "fundamental recovery" (volume growth, emerging markets, 61.5% gross margin) and a "valuation premium" (26x P/E ratio above the 10-year average of 24x, dividend yield below norm). The two are not contradictory, but they impose different requirements on the path ahead — fundamental recovery must continue to materialize to support the valuation premium; if volume or emerging market growth slows, pressure for the valuation to revert toward the 10-year average will emerge.
2. GPIX Trades an Option Coverage Ratio of About 35% for Stronger Price Appreciation Potential
1. GPIX's Option Coverage Ratio of About 35%, Lower Than SPYI, Delivers Better Price Appreciation
According to a comparative analysis published by Seeking Alpha on October 22, 2026, the Goldman Sachs S&P 500 Premium Income ETF (GPIX) has an option coverage ratio of about 35%, lower than SPYI, and performs better on price appreciation. The mechanism is not complicated: the lower the coverage ratio, the smaller the portion of the portfolio "capped" by the options strategy, and the higher the NAV's participation in the underlying index's gains.
This means GPIX and SPYI are not different brand versions of the same product, but two trade-offs: a higher coverage ratio typically means thicker premium income and more substantial cash distributions; a lower coverage ratio means sacrificing some current income in exchange for NAV upside. GPIX's roughly 35% coverage ratio essentially chooses the latter between "cash flow thickness" and "NAV upside." Note that "better price appreciation" is a relative result over a specific observation period and should not be extrapolated as necessarily persisting in the future.
2. Return of Capital Brings Tax Efficiency, but Neither ETF Provides Downside Protection
Both ETFs share one common feature in their distribution structure: according to the analysis, both GPIX and SPYI achieve tax efficiency through return of capital. In accounting treatment, return of capital means part of the distribution is not counted as current taxable income, which has practical significance for investors in high-tax-bracket accounts. But there is a boundary that is easily confused here: tax efficiency does not equal earning capacity, and certainly does not equal risk protection.
The analysis explicitly states that neither provides downside protection. This point deserves repeated emphasis, because the product names and distribution rates of income ETFs can easily create an illusion of "stability." Options strategies sell volatility and collect premiums; they do not constitute insurance against the underlying's decline. When the market continues to draw down, both ETFs' NAVs will also suffer losses. In addition, return of capital may also include a principal-return component, and long-term distribution rates are not guaranteed returns.
3. The Choice for Income ETFs: Cash Flow Thickness or NAV Upside
Abstracting the differences between GPIX and SPYI, investors face a multiple-choice question about volatility pricing: if you judge that the underlying index will rise moderately, a lower option coverage ratio (such as GPIX's ~35%) may deliver better total returns because there is more room for NAV appreciation; if you judge that the market will be mainly range-bound and you value current cash flow more, a higher coverage ratio may better fit your needs.
There is no standard answer to this question, but it requires investors to clarify their own objective function. GPIX's roughly 35% coverage ratio, relatively better price appreciation and the tax efficiency from return of capital together form a "growth-oriented income" profile; SPYI's relatively higher coverage leans more toward "cash-flow-oriented income." The shared constraint that neither provides downside protection reminds investors that risk hedging still needs to be considered separately at the portfolio level.
3. Meta's Muse AI Eases AI Capex Concerns, but Negative Free Cash Flow Remains a Hard Constraint
1. Family ARPP Grows 22.5% Year Over Year, Ad Prices Accelerate While User Growth Slows
According to Seeking Alpha's October 22, 2026 analysis, Meta Platforms' third-quarter Family ARPP (average revenue per user) grew 22.5% year over year, ad prices accelerated upward, but user growth slowed. The combined meaning of this data set is that growth momentum is shifting from "user base expansion" to "per-user monetization."
When user growth slows while revenue per user accelerates, it shows that the platform's monetization capability is improving. For investors, this shift in growth structure has two sides: on one hand, it proves there is still room to improve monetization efficiency across the existing user base; on the other hand, it means future growth relies more on ad prices and ad formats, and the buffer provided by user base expansion is thinning. Note that the above metrics are relayed from third-party analysis; this article has not verified specific definitions or quarter attribution against Meta's official filings.
2. Strong Muse AI Adoption Plus Share Price Pullback Leads to Reiterated "Strong Buy" Rating
Against a backdrop of both AI narrative and financial skepticism, Muse AI is seen as a key balancing item. The same analysis states that Meta was reiterated as a "Strong Buy" on strong Muse AI adoption and attractive valuation after a recent share price decline. This contains two independent supporting factors: product-side adoption data and price-side pullback.
It should be clear that "Strong Buy" is a rating from sell-side/third-party research firms and is an opinion, not a fact; "strong adoption" likewise lacks a public quantitative definition (such as active users, time spent or revenue contribution). Therefore, the judgment that Muse AI eases capex concerns is currently closer to a narrative-level explanation and still needs validation from subsequent financial data.
3. High Capex and Negative Free Cash Flow Are the Other Side of the AI Narrative
The same analysis also clearly points out the concerns: high capital expenditure and negative free cash flow. This is the direct financial cost of the AI investment phase and a hard constraint that the "Strong Buy" rating must confront. Negative free cash flow means that even as monetization efficiency improves on the operating side, AI-related investment is still a net cash drain, and the financial digestion period is not yet over.
Putting 22.5% year-over-year Family ARPP growth together with negative free cash flow, Meta's current state can be summarized as "improving monetization efficiency coexisting with cash burn." This does not deny the rationality of AI investment, but it changes the valuation anchor: when free cash flow is negative, the traditional discounted free cash flow framework temporarily fails, and the market must turn to monetization efficiency, adoption data and the path to future cash flow recovery as pricing bases. It should be added that the accounting and depreciation cycles for large tech companies' capital expenditure are long, so a single quarter or short-term negative free cash flow does not necessarily equal long-term value destruction — but equally, it cannot be inferred from this that the investment will necessarily generate returns.
4. All Three Threads Point to the Same Thing: The Market Is Repricing "Certainty"
1. Defensive Cash Flow Coexisting with High Valuation Means the Premium Buys Certainty, Not Growth
Colgate's case illustrates this best: according to the analysis, a 61.5% gross margin and a 26x P/E ratio (above the 10-year average of 24x) appear simultaneously, while the dividend yield is below its long-term norm. If the market were buying growth, a consumer staples company should not command a valuation above its own 10-year average; if the market were buying dividends, a dividend yield below norm would contradict that logic. One self-consistent explanation is that capital is willing to pay a premium for "stable cash flow and validated volume recovery."
The fragility of this explanation is that it relies heavily on fundamentals continuing to materialize. If volume growth and emerging market exposure continue in subsequent quarters, the 26x P/E ratio has support; if they slow, pressure for the valuation to revert toward the 10-year average will emerge. Whether the valuation tolerance for defensive assets has risen still needs more samples to verify; a single company's single-day performance is insufficient to support an industry-level conclusion.
2. The Trade-off in Income ETFs Is Essentially a Disagreement Over Volatility Pricing
The difference in coverage ratios between GPIX and SPYI (GPIX at about 35%, lower than SPYI) appears on the surface to be a product design difference, but is essentially investors' differing pricing of volatility and NAV upside. Choosing a lower coverage ratio means believing that the value of upside participation exceeds the thickness of current cash flow; choosing a higher coverage ratio means placing more emphasis on distribution stability.
This disagreement has extra significance in the current environment: when the market simultaneously has a valuation premium in defensive assets and cash flow uncertainty during the AI investment phase, volatility itself becomes a resource that needs to be priced. The shared feature that neither ETF provides downside protection is precisely a reminder to investors: the choice of income products cannot replace portfolio-level risk management.
3. In the AI Investment Phase, the Valuation Anchor Shifts from Profit to Monetization Efficiency and Cash Flow Path
Meta's case shows the migration of the valuation anchor in the AI cycle: Family ARPP grew 22.5% year over year and ad prices accelerated, showing monetization efficiency is still improving; strong Muse AI adoption shows signs of product-side traction; but high capital expenditure and negative free cash flow show the financial side has not yet finished digesting. The result of these three coexisting is that the market finds it difficult to price Meta with a single profit metric.
The valuation anchor therefore shifts to two dimensions: monetization efficiency (such as Family ARPP growth) and the cash flow recovery path (when capital expenditure converts into positive free cash flow). Muse AI eases capex concerns, but easing is not solving — negative free cash flow remains a hard constraint, and the subsequent financial validation period is not over.
4. Three Asset Types Discussed on the Same Day Point to the Same Certainty Preference
Consumer staples (Colgate), option-income ETFs (GPIX and SPYI) and large-cap tech (Meta) have vastly different risk-return characteristics, yet they are discussed side by side in the same day's analyses. Their commonality lies not in industry or asset class, but in the interpretation of pricing logic: the market is using different tools to reprice "certainty." This summary is an editorial interpretation, not a verifiable market fact.
Colgate's certainty comes from a gross margin supported by volume and emerging markets; GPIX's certainty comes from a clearer upside participation rule under a ~35% coverage ratio; Meta's certainty comes from a monetization efficiency narrative supported by Muse AI adoption data. The three certainties differ in quality and validation cycle, but together they form one lens through which to observe the current structure of US equities.
Final Thoughts
The simultaneous appearance of a record gross margin and an above-average P/E ratio in consumer staples suggests that valuation tolerance for defensive assets may be rising. Colgate's 61.5% gross margin is the evidence of fundamental recovery described by the analysis, the premium of a 26x P/E ratio over the 10-year average of 24x is the evidence that the market is willing to pay for that recovery, and the dividend yield below its long-term norm reminds us that this premium buys certainty, not income.
The difference in coverage ratios among income ETFs reminds investors that tax efficiency and downside protection are two different things. GPIX's roughly 35% coverage ratio delivers relatively better price appreciation, and both GPIX and SPYI achieve tax efficiency through return of capital, but neither provides downside protection — the choice of income products ultimately comes back to investors' own preferences for volatility and cash flow.
Meta's Muse AI eases capex concerns, but negative free cash flow means the financial validation period for AI investment is not over. Family ARPP growth of 22.5% year over year and accelerating ad prices prove monetization efficiency; strong Muse AI adoption and the share price pullback together support the reiterated "Strong Buy," but high capital expenditure and negative free cash flow remain hard constraints that must be overcome.
Future observation points can focus on three areas: the sustainability of Colgate's volume and emerging market growth, which determines whether the premium of the 26x P/E ratio over the 10-year average can hold; the price appreciation gap between GPIX and SPYI, which tests the actual effect of the low-coverage-ratio strategy in different market environments; and the pace of repair in Meta's capital expenditure and free cash flow, which determines when the AI narrative moves from "easing concerns" to "financial delivery."
Risk disclosure: Macroeconomic conditions and the US equity market are highly volatile. This content is for the academic and research observation reference of MSX Research only and does not constitute any investment advice. The specific figures and ratings in this article are relayed from third-party analysis and have not been independently verified.
Invest in AI RWA
References
This article is produced by the MSXGO editorial team, AI-assisted, and reviewed through an editorial process. Fee rates and figures are subject to each platform's latest official announcements.
FAQ
What are Colgate's gross margin and valuation levels? ▼
According to Seeking Alpha's October 22, 2026 analysis, Colgate-Palmolive's gross margin is 61.5% (which the analysis calls a record level), fundamentals have recovered with volume growth and benefit from emerging markets; its adjusted P/E ratio is about 26x, above its 10-year average of 24x, and its dividend yield is below its long-term norm. These figures are relayed from third-party analysis and have not been independently verified against company filings.
What is the core difference between GPIX and SPYI? ▼
The core difference is the option coverage ratio: GPIX is about 35%, lower than SPYI, and therefore performs better on price appreciation; both achieve tax efficiency through return of capital, but neither provides downside protection. The price appreciation advantage is a relative result over a specific observation period and does not mean it will necessarily persist.
Why is Meta's Muse AI seen as easing AI capex concerns? ▼
According to Seeking Alpha analysis, Meta was reiterated as a "Strong Buy" on strong Muse AI adoption and attractive valuation after a recent share price decline. The adoption data is used to address the question of whether AI investment can translate into product usage and commercial value, but the analysis also notes that high capital expenditure and negative free cash flow remain concerns, and that "strong adoption" lacks a public quantitative definition.
How did Meta's third-quarter Family ARPP grow? ▼
According to Seeking Alpha analysis, Meta Platforms' third-quarter Family ARPP grew 22.5% year over year, ad prices accelerated upward, but user growth slowed, shifting growth momentum from user base expansion to per-user monetization. This data is relayed from a third party and has not been verified against official filings.
By how much did Colgate outperform the Nasdaq in a single day? ▼
According to Seeking Alpha's October 22, 2026 analysis, Colgate outperformed the Nasdaq by about 7 percentage points in a single trading day. This is single-day relative performance and cannot be directly extrapolated into a trend.
Finished reading? Ready to try trading?
Tokenized stocks/ETFs, crypto spot, and perpetual futures in one account — perp maker 0.02% / taker 0.045%, RWA spot buy 0.3% / sell 0.
Free sign-up · 3 quick steps