Bitcoin Pushes Above $80K: Weekly Breakout, Chase Risk, and Key Structural Levels
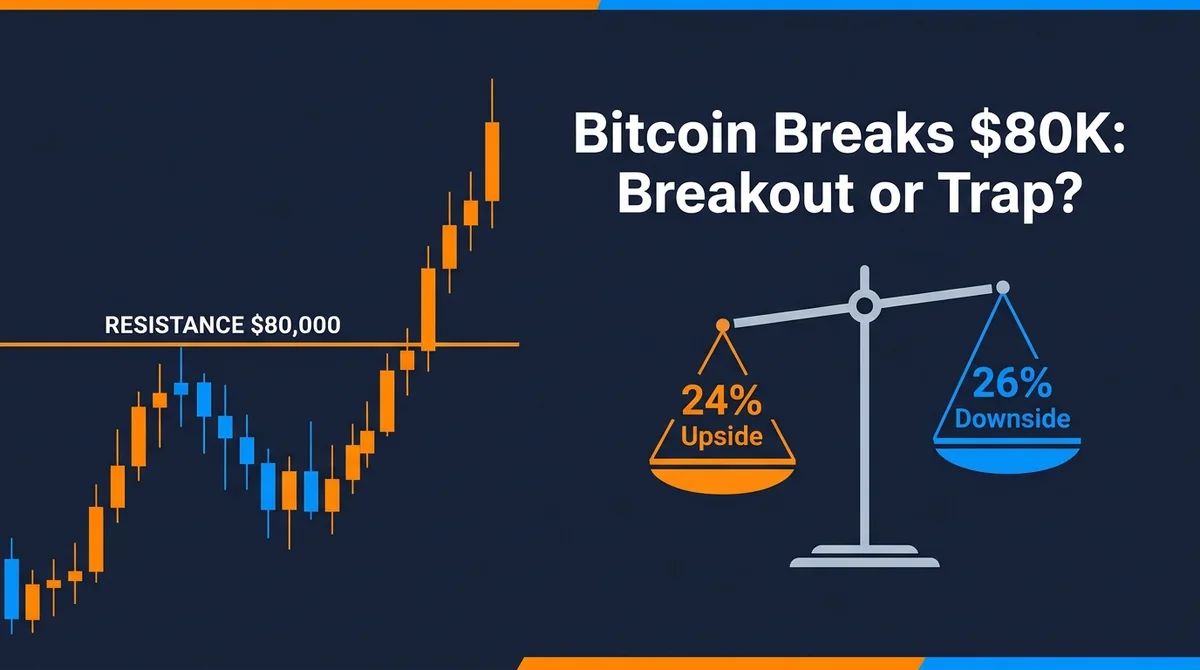
Bitcoin rallied about 20% in three days to top $80K. We break down the weekly breakout structure, chase risk-reward, and key neckline levels.
Article Citation Summary
Bitcoin rallied about 20% in three days to top $80K. We break down the weekly breakout structure, chase risk-reward, and key neckline levels.
Bitcoin has surged directly from a consolidation range to above $80,000 in a very short time, with market sentiment quickly turning optimistic and calls of a "bull market return" starting to cluster. But when sentiment is at its hottest, what deserves a calmer breakdown is: where this rally sits in terms of technical structure, whether the risk and reward of chasing the move are symmetric, and which key price levels would change the current read. Below we analyze this from three angles: structure, risk-reward ratio, and the trading perspective.
1. The Facts: A ~20% Move in Three Days With Almost No Turnover
Looking at price action, Bitcoin completed a breakout above a short-term consolidation zone in an extremely short period, then moved straight up to around $80,000, gaining about 20% in three days with almost no visible turnover along the way.
There are two interpretations of this kind of move:
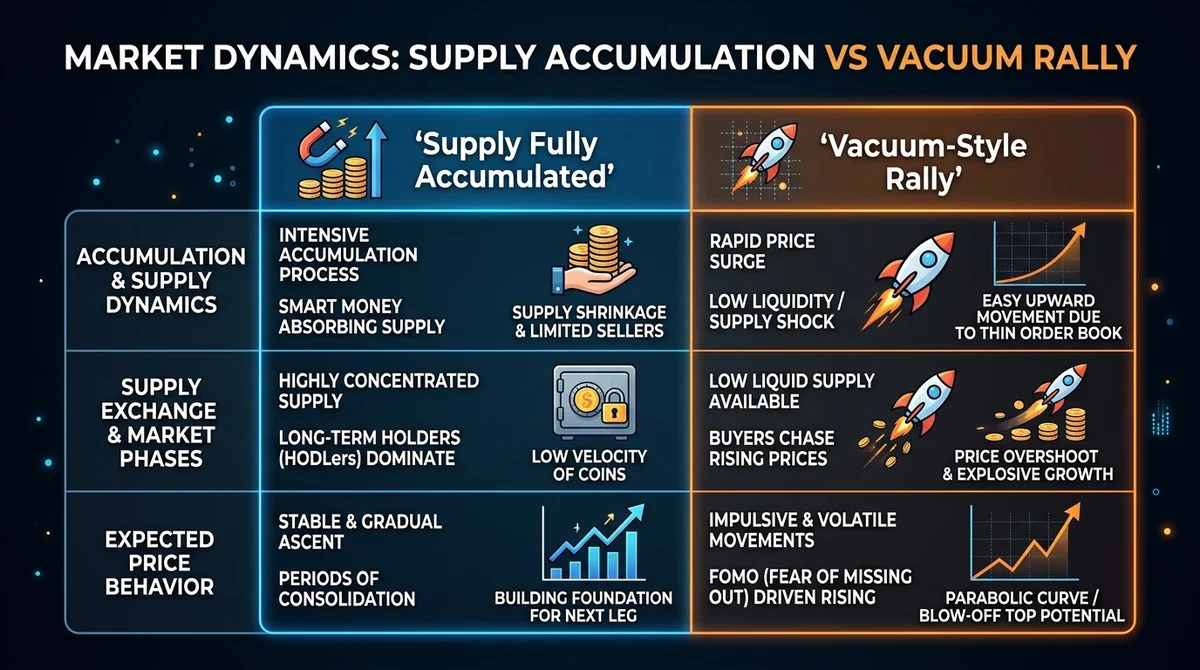
- Supply already fully accumulated: if accumulation at the bottom range lasted long enough and large holders have concentrated their positions, a direct rally into a trending market is reasonable;
- A vacuum-style rally: if both the decline and the rally were vacuum zones lacking any exchange of supply, the market could see violent back-and-forth action at key levels, the so-called "door-drawing" style of rapid round trips.
These two interpretations point to completely different responses, which is why it is unwise to sum up the current situation with a single phrase like "the bull market is here."
2. Has the Bull Market Returned? Look First at the Weekly-Scale Structural Breakout
Judging whether a larger-degree trend has reversed usually requires a weekly-scale breakout at a key structural point, not just consecutive gains on the daily or hourly chart. In other words, before a key weekly level is effectively broken, there is not enough basis to define the current move directly as a "bull market return."
This distinction matters especially for spot traders: once "bull market return" is used to justify chasing longs in spot, many people subconsciously abandon stop-loss settings and turn a short-term call into a long-term holding commitment. If the market has not actually entered a trend, this mindset significantly amplifies drawdown risk.
3. The Risk-Reward Ratio of Chasing: Do the Math Before Going Long
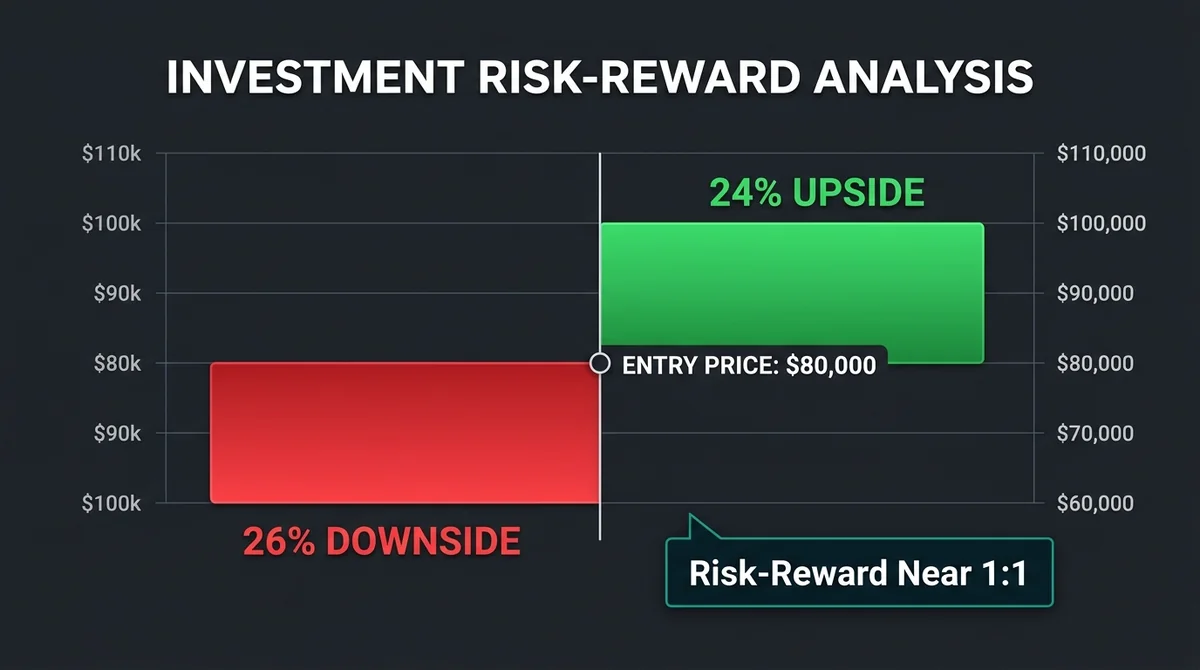
Chasing spot longs directly around $80,000 requires a simple risk-reward calculation first. Assume an upside target of $100,000, which corresponds to roughly 24% of upside; and based on a standard technical stop-loss reference, the downside stop could be around 26%. The two are roughly comparable, meaning the risk-reward ratio of chasing at this level is not favorable.
This is not to say the market cannot keep rising, but rather that: going heavily long at a point where risk and reward are roughly symmetric is essentially trading high uncertainty for limited odds. Unless it is explicitly defined as ultra-short-term trading, chasing at the current position requires stricter position sizing and stop-loss discipline.
4. Key Structural Levels: Channel Top and the Neckline Near 75,500
From a pattern perspective, the price hit the top area of a potential ascending channel exactly at the overnight high and was temporarily rejected there. In technical analysis, the top of a channel is often where bulls and bears diverge more sharply.
The structure below deserves more attention: around $75,500 is the current key short-term reference, with the $75,000 area worth watching just below it. If the price breaks below this zone, it could trigger a short-term structural turn on the daily chart, and against a backdrop where both the rally and the decline were vacuum zones, a loss of key levels is often followed by back-and-forth shakeouts.
For bulls, 75,500 to 75,000 is the support band to watch closely right now; for those attempting to short, the channel top is a natural risk-control reference, but note: in a strong rally, counter-trend trades should wait for more extreme levels rather than guessing a top mid-trend.
5. Right-Side Confirmation: Why $83,000 Is the Key Level to Watch
If the price rises further and effectively breaks above the $83,000 area, that would mean a weekly-scale breakout above the prior high zone, at which point the "bull market return" call would have stronger technical support and the bearish view would need to be revised accordingly.
It is worth stressing that this kind of level is a right-side signal: it requires the price to complete the breakout before confirmation, rather than guessing a top on the left side at the channel top in advance. The first touch of the channel top can be traded based on the pattern, but once the pattern is broken, the same method should not be reused.
Another scenario widely discussed in the market: the price first spikes to around 83,000 to grab liquidity, then quickly falls back, trapping both longs and shorts. Such moves can only be identified via right-side signals and cannot be precisely predicted in advance.
6. Futures vs. Spot: Two Completely Different Perspectives
Short-term futures trading and spot trading depend on market conditions to different degrees. From the futures perspective, traders do not need to judge whether the market is in a bull or bear phase—both long and short directions can be traded, and the key lies in discipline and risk control; the spot perspective, by contrast, relies more on judging the larger-degree trend and has a smaller margin for error.
So the question "can I chase now?" has no single answer; it depends on the trading timeframe and the instrument chosen:
- Short-term futures: focus on structural levels and risk control; do not get hung up on labeling bull or bear;
- Spot allocation: wait for a weekly-scale confirmation signal and plan stop-losses and position sizing in advance.
7. Risk Disclosure
Crypto asset prices are highly volatile. All price levels and structural analysis in this article are discussions at the level of technical methodology only; they do not constitute any investment advice or any prediction of price direction. Any trading decision should be based on your own risk tolerance, with strict execution of stop-losses and position management.
In a market environment where sentiment is highly unanimous, maintaining independent judgment and calculating risk before reward is often more important than following trade calls.
This article is produced by the MSXGO editorial team, AI-assisted, and reviewed through an editorial process. Fee rates and figures are subject to each platform's latest official announcements.
Finished reading? Ready to try trading?
Tokenized stocks/ETFs, crypto spot, and perpetual futures in one account — perp maker 0.02% / taker 0.045%, RWA spot buy 0.3% / sell 0.
Free sign-up · 3 quick steps