Bitcoin Tests Key Resistance: Fibonacci Extension Targets and Order Flow Signals
Bitcoin hits the 1:1 Fibonacci extension and daily resistance as order flow, CVD and the Fear & Greed Index hint bullish momentum may be fading.
Article Citation Summary
Bitcoin hits the 1:1 Fibonacci extension and daily resistance as order flow, CVD and the Fear & Greed Index hint bullish momentum may be fading.
Bitcoin has extended its recent rally and reached the primary price target set out earlier. From a technical analysis standpoint, this leg higher may be approaching a local end. Below, we break down the current bull-bear tug-of-war across price targets, order flow signals, indicator confluence and key support and resistance levels.
Note: This article discusses technical analysis methods and market structure. It is not investment advice or a trading recommendation. Crypto asset prices are highly volatile; please make your own judgment and manage risk carefully.
1. Price Target: The 1:1 Fibonacci Extension Has Been Reached
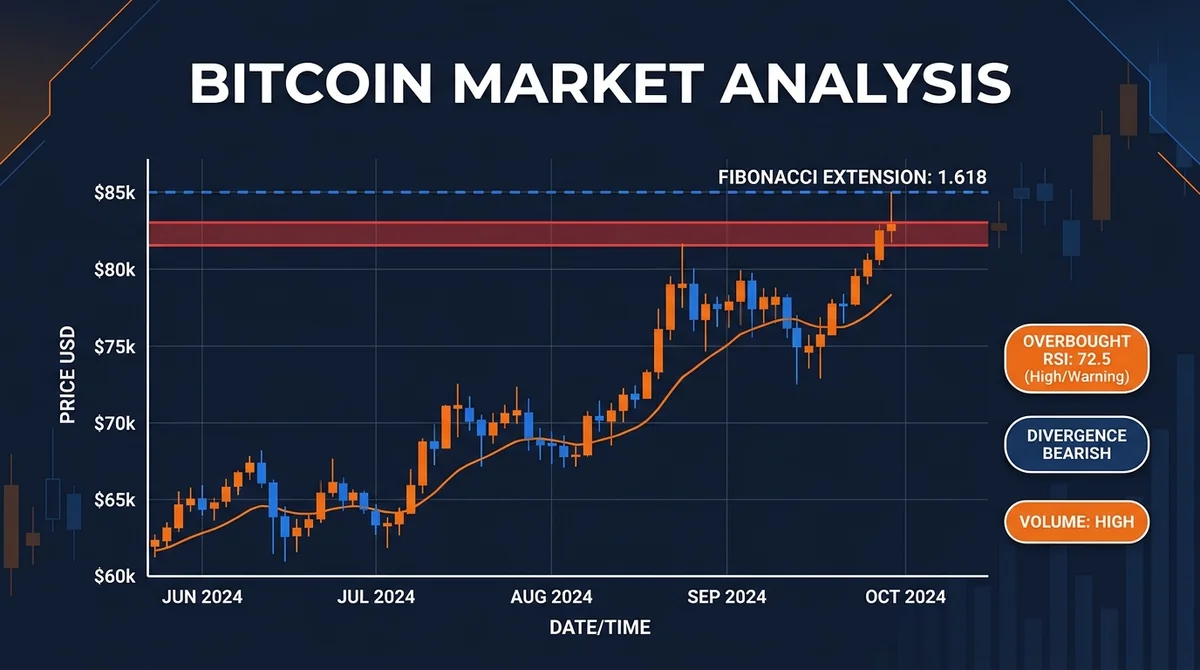
The first target discussed in the previous session — the 1:1 Fibonacci extension at roughly $79,800 — was reached by price with near-precision. On the 30-minute and even 1-hour timeframes, price briefly swept liquidity above recent highs before closing back below them.
Above that level, the next resistance comes from the daily higher-timeframe resistance zone around $81,000, and price has already pushed into that area as well.
It is worth noting that the 1:1 extension differs slightly on logarithmic versus non-logarithmic charts, but under both measures the target was reached fairly completely. This means price is now sitting at the intersection of multiple technical targets — a zone that warrants close attention.
2. Why Price Did Not Top Directly at the 1:1 Extension
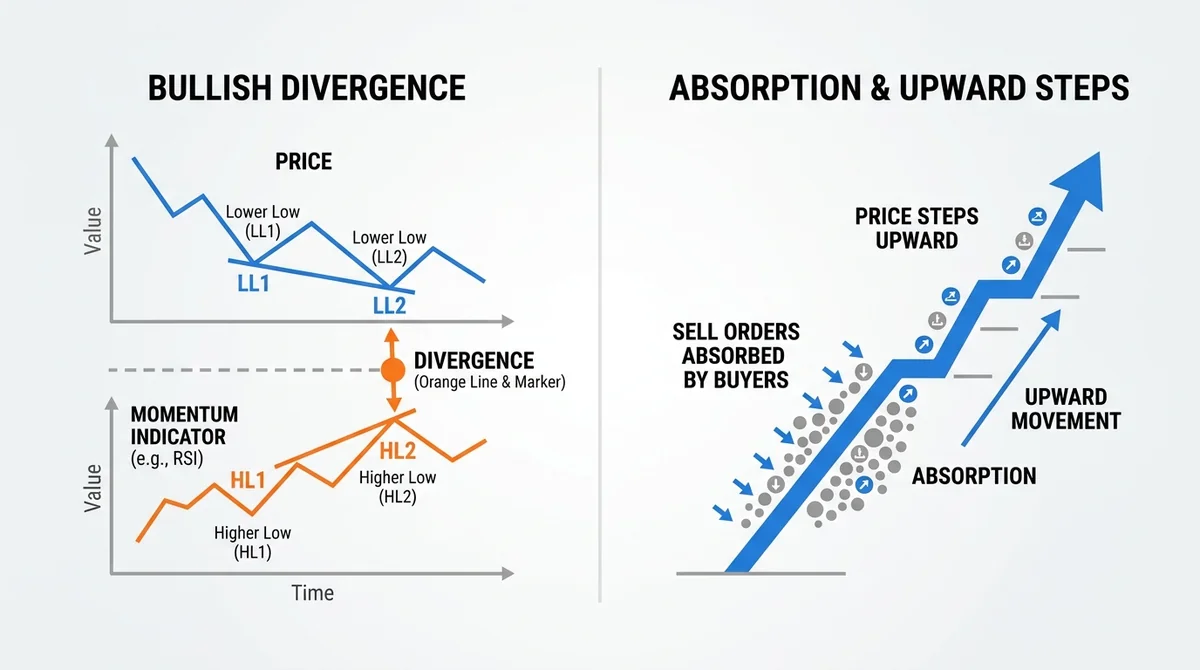
That price broke through the first target and kept climbing can be explained through order flow:
- CVD (Cumulative Volume Delta): measures the net flow of buying versus selling pressure. In this area, CVD briefly pushed lower, indicating sell pressure entering the market.
- Open Interest: reflects whether new capital is entering.
- Divergence structure: CVD printed a lower low while price printed a higher low, forming a bullish divergence accompanied by bullish absorption.
In short, a large number of participants (including short-term shorts) established sell positions at that level, but the market did not see a corresponding deep pullback. After the sell pressure was absorbed, price was instead pushed higher, until it reached the daily higher-timeframe resistance zone.
3. Indicator Confluence: Bearish Signals Across Multiple Timeframes
Daily Timeframe
- A custom momentum indicator has confirmed a bearish signal point on the daily; if the daily close holds the current shape, it will be further confirmed.
- RSI: still in overbought territory. Historically, when daily RSI enters overbought territory, price is often already near historical high zones — this signal does not appear often.
- Money Flow Index: although not yet overbought, price has printed a significantly higher high while the indicator formed a lower high. If price then rolls over, this would constitute a hidden bearish divergence.
4-Hour Timeframe
Price formed a higher high at the resistance zone while the momentum indicator formed a lower high, creating a bearish divergence — the most clearly bearish of all timeframes.
2-Day Timeframe
Historically, when this momentum indicator enters overbought territory, it tends to correspond to local tops in Bitcoin; previous overbought readings were followed by bearish signal points and pullbacks of varying degrees. It has now entered that zone again.
4. Sentiment: Fear & Greed Index Enters Extreme Greed
The Crypto Fear & Greed Index currently reads around 82, placing it in extreme greed territory. Looking back at 2023 and 2024, after the index entered extreme greed, price often formed a local top followed by a pullback; in some cases price still edged slightly higher, but overall this zone warrants heightened caution.
5. If the Rally Continues: Next Target and an ABC Correction Structure
If price extends its advance, watch the top of the large daily horizontal range around $83,000. The lower boundary of that range saw repeated liquidity sweeps followed by bounces several weeks ago, so the upper boundary may produce a similar structure: price breaks slightly above the range high, sweeps liquidity above the highs, forms a brief deviation and then pulls back.
In this scenario, the correction pattern may no longer be the symmetrical triangle discussed earlier, but rather a flat ABC correction:
- Wave A: the pullback from the prior high;
- Wave B: the rebound recovery;
- Wave C: the current leg higher.
Measured with Fibonacci time cycles, a key time node falls at the end of September 2026; measured with trend-based Fibonacci extensions, the 1:1 target has been met, and the next level — the 1.236 extension — sits around $86,000, slightly above the upper boundary of the horizontal range.
6. If a Pullback Comes: First Key Support
Price remains within a large horizontal range. Measured by fixed-range volume profile, the value area high is around $74,000; on the 4-hour timeframe, the anchored VWAP anchored to the start of this rally is also trending higher and may coincide with the value area high. So if a pullback begins, the $73,500–$74,000 zone is the first local support band to watch.
7. What to Watch in Terms of Trade Structure
From a market structure perspective, the 30-minute timeframe is still bullish, with price holding above recent highs, so opening a directional position at this level carries relatively high risk. A more prudent approach is to wait for signs of weakening:
- Build a volume profile over the upper price range; the value area high is around $78,800;
- If price breaks below that level and finds acceptance beneath it, that constitutes a bearish signal;
- Until then, market structure remains bullish and patience is required.
Summary
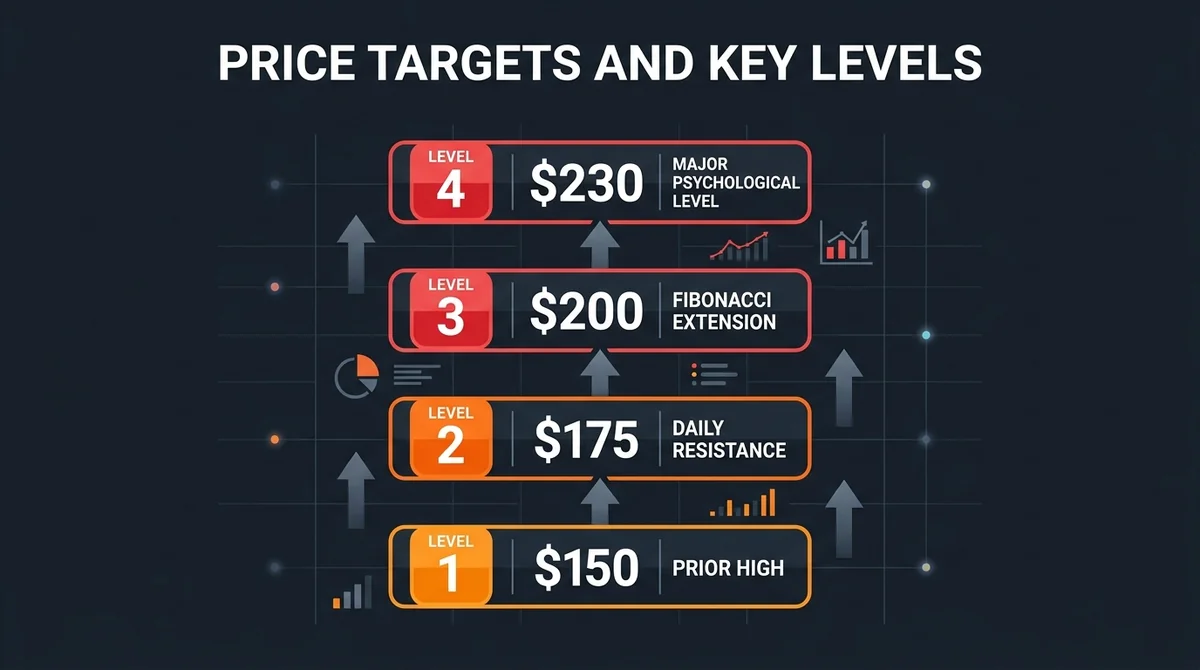
Bitcoin currently sits at the intersection of multiple technical targets: the 1:1 Fibonacci extension has been met, daily resistance around $81,000 has been tagged, momentum indicators show bearish characteristics on the daily, 4-hour and 2-day timeframes, and sentiment has entered extreme greed. To the upside, $83,000 and $86,000 (the 1.236 extension) are potential targets for further gains; to the downside, $73,500–$74,000 is the first key support band. Market structure has not yet confirmed a turn lower — whether price finds acceptance below $78,800 is an important observation point for judging short-term direction.
Reminder: The above is a discussion of market structure within a technical analysis framework. It is not investment advice and does not constitute a buy or sell recommendation for any asset.
If you wish to trade crypto spot or derivatives on a compliant platform, you can look into MSX's relevant products and fee information, and assess the risks yourself.
This article is produced by the MSXGO editorial team, AI-assisted, and reviewed through an editorial process. Fee rates and figures are subject to each platform's latest official announcements.
Finished reading? Ready to try trading?
Tokenized stocks/ETFs, crypto spot, and perpetual futures in one account — perp maker 0.02% / taker 0.045%, RWA spot buy 0.3% / sell 0.
Free sign-up · 3 quick steps