Will Bitcoin Drop Another Leg? Buy Logic and DCA Strategy for Mid-Term Years
A look at Bitcoin's mid-term year buying window, dynamic DCA, and timing pitfalls—why most gains come from the trend's middle, not the perfect bottom.
Article Citation Summary
A look at Bitcoin's mid-term year buying window, dynamic DCA, and timing pitfalls—why most gains come from the trend's middle, not the perfect bottom.
Bitcoin's price patterns in mid-term years are an important reference framework for many long-term holders when setting their buying pace. The following is compiled from one crypto analyst's personal observations and approach. It reflects the interviewee's personal views, does not constitute investment advice, and should not be treated as a prediction of price levels.
Why Put the Buying Window in the Second Half of Mid-Term Years
The analyst's approach is to start buying Bitcoin in batches during the second half of mid-term years. His reasoning comes from historical observation—Bitcoin tends to weaken overall in the first half of mid-term years, and most of the rallies during that period are bear-market bounces that get sold afterward.
He admits he made plenty of mistakes in his early years and only truly learned the lesson in 2018. Since then, he started buying in the second half of the 2022 mid-term year and plans to repeat the same approach in 2026.
It is worth stressing that starting to buy does not mean the bottom has formed. He makes clear that no one can truly determine whether a bottom is in, and that debate often continues for weeks after a rally. But over a longer time horizon, looking back a year later, the exact price at which you started building a position may matter far less than what the market goes through before then.
The Value of DCA: Reducing Timing Pressure
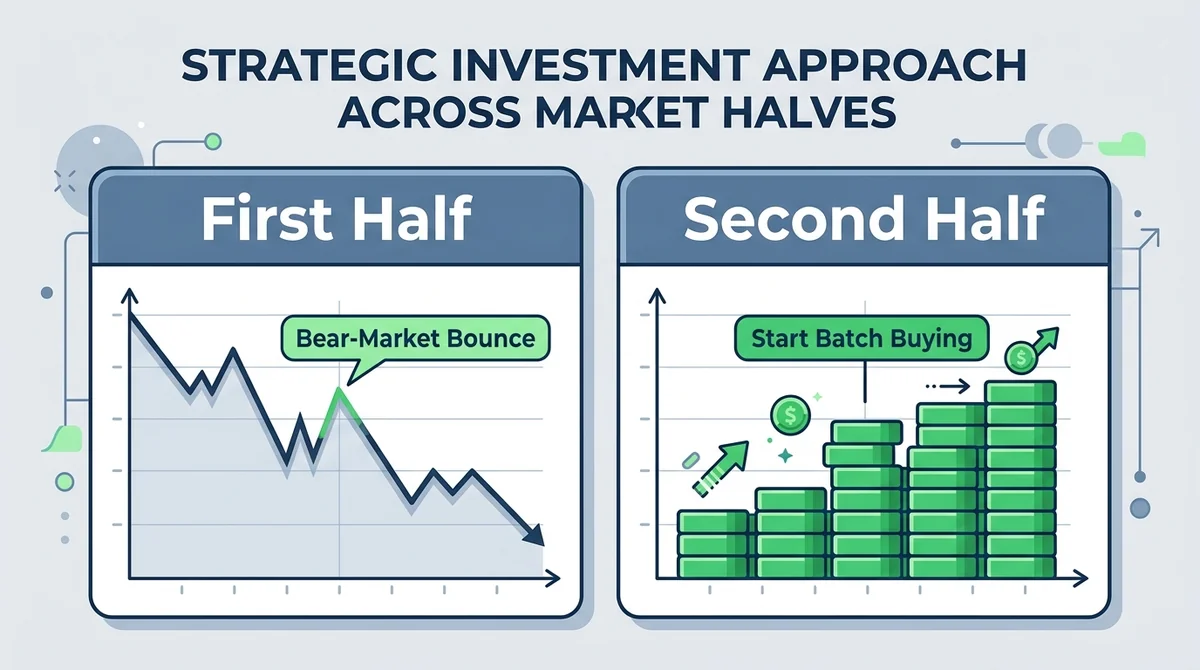
In his view, one practical benefit of simply starting to DCA is that it eases psychological pressure. When the market rallies sharply, those who already hold a position are less likely to chase highs out of fear of missing out.
Conversely, if you buy nothing at all in the second half, you can fall into the trap of "buying every lower high." He notes that many people have repeated this behavior during this year's rallies.
He also cautions that this is only an analytical framework based on historical patterns. It does not prove a low is in, and only the end of the mid-term year will confirm it. He acknowledges he could easily be wrong and notes that he has held a bearish view of the market for roughly the past nine to ten months.
Timing Pitfalls: Missing the Low Doesn't Mean Sitting Out the Whole Cycle
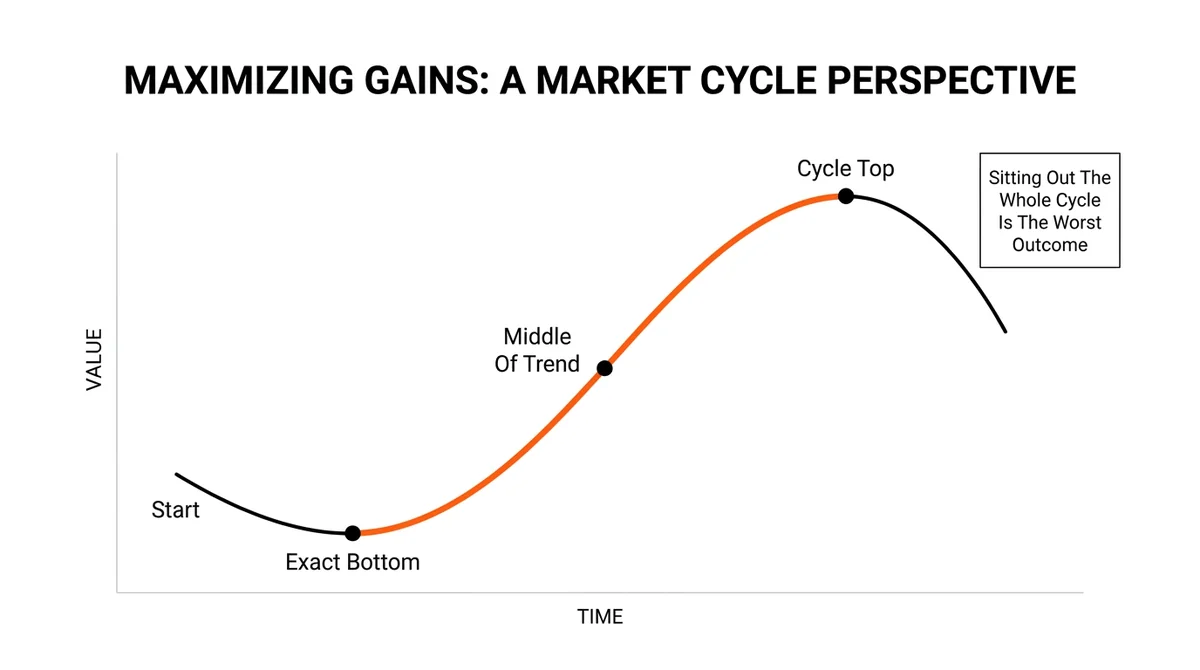
He observes that many people's mistake is this: if they can't nail the exact bottom, they simply give up on the entire bull market. But in reality, most of the gains come in the middle of a trend, not at its start.
The same logic applies on the downside. Many people, having missed the top, decide they simply cannot take profit and are unwilling to sell at a set drawdown from the top—then watch their assets fall sharply.
His conclusion: if you don't believe Bitcoin will see another decline before year-end, then buying now is not unreasonable, and the current range is a relatively sensible entry reference compared with the highs of several months ago. But he stresses this is only a relative comparison and not a judgment on what comes next.
When Not to DCA
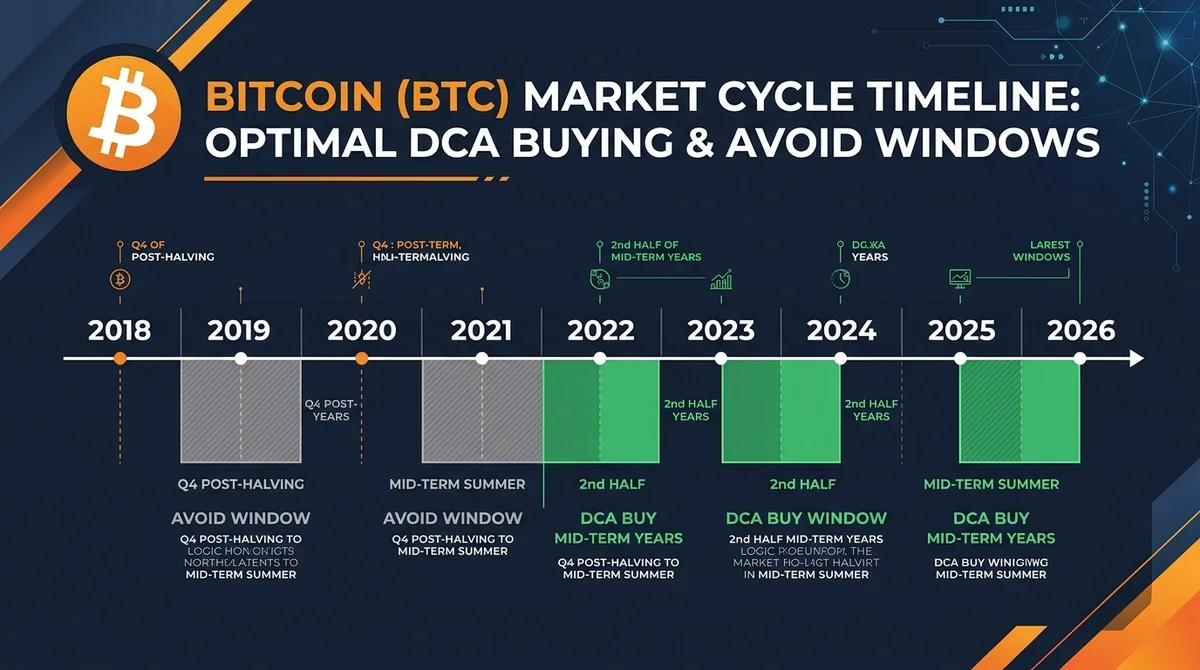
He generally does not DCA in the first half of mid-term years, because the overall market trend during that period tends to be downward. In addition, buying heavily at the tail end of post-halving years is not very reasonable either, since that is usually close to when the cycle top forms.
His rough avoidance window runs from some point in the fourth quarter of the post-halving year through the summer of the mid-term year. The reason is that during this stretch Bitcoin tends to underperform other assets overall—it looks weak against stocks, gold, energy, and even the dollar. This period is therefore better spent paying attention to other investment vehicles.
Dynamic DCA: Start Small, Then Add on Drawdowns
For holders worried about further declines after entering, he proposes "dynamic DCA," a concept he began discussing as early as 2019.
The approach: suppose you plan to invest a sum over the next four months. You could put a very small portion in during the first month, then keep making small purchases each month; if larger declines follow, gradually increase buying and allocate more capital to the months with deeper drawdowns.
He suggests a starting allocation of about 10% to 15% of the planned total. That way, even if you're wrong and the market doesn't fall, you've already built part of a position and won't regret being too fearful over the next year or two; and if the market does fall, that's the time to deploy fully.
He also mentions that he buys index funds on a fixed schedule every month regardless of his view on the market. Sometimes his timing calls are right, sometimes wrong.
The Opportunity Cost View: Why Focus on Bitcoin
He stresses that he places great weight on opportunity cost. Over the past several years, his repeated view has been that altcoins as an asset class have performed quite poorly overall. Though a few individual names do well each year, altcoins as a whole have kept weakening relative to Bitcoin.
That is why he has focused mainly on Bitcoin for roughly the past six years. But he also points to Bitcoin's own problems: even in an up market, Bitcoin has still been weakening this year relative to most other assets—against gold and against stocks alike.
He notes that Bitcoin's valuation relative to the S&P 500 is roughly where it was five or six years ago. That raises a question: if you're taking on higher risk without beating an index fund, what is the point of taking that extra risk? Index funds also pay dividends, while a single asset exposes you to idiosyncratic risk.
His stance: as long as an asset's risk-adjusted return is still worthwhile, he is willing to bear idiosyncratic risk; once it no longer is, it becomes hard to keep viewing it as an attractive investment.
He also cites a self-custody risk case—a user who followed advice to hold their own private keys and still suffered losses. He considers such events third-party failures rather than a reflection on Bitcoin itself, but for ordinary users that distinction is hard to accept, and it is a reality the industry must face.
Why Mid-Term Years Matter: Historical Patterns and Stock Market Linkage
Responding to doubts about the four-year cycle, he says: judging purely by results, ignoring mid-term year weakness this year was unwise. Bitcoin has fallen sharply this year.
He further notes that there is more than three data points to consider: stock markets also post major lows roughly every four years—for example 2014, 2018, and 2022—and the earlier decades of the 1950s to 1970s showed a similar rhythm. He admits he cannot explain the exact cause; it may involve liquidity, or it may relate to markets tending to be pushed higher in the first year of a new president's term. But he chooses to respect what has already happened.
He also notes that stocks pulled back in the first half of this year, and it was during that pullback that Bitcoin fell. If stocks pull back again toward year-end, that could be a catalyst for further Bitcoin downside; if stocks don't pull back, his judgment may be wrong.
On Whether There Will Be Another Leg Down Before Year-End
The decline window he previously mentioned is not limited to a single month but is based on the observation that historical bear markets last about a year. He still sees a relatively high probability that the low falls within that window.
He cites historical comparisons: in the 2018 mid-term year, Bitcoin staged several rallies in May, July, and August before a larger decline followed. This year has seen a similar rally pattern. That doesn't mean history must repeat, but it shows such rallies are not unusual in mid-term years and did not mean the bear market was over at the time.
He points out that the market contains contradictory indicators: some suggest a bottom is in, which is itself a reason to DCA; but others that are typically triggered only in bear markets have not yet appeared. Investors tend to cherry-pick whichever indicators they want to believe.
He also raises the concept of "time-based capitulation": if the market does not decline before year-end, the rationale for staying bearish disappears, and at that point it is reasonable to stop being bearish. He sees the decline window as roughly the next three to four months, not extending into next spring.
Observations on Gold and US Stocks
On whether gold has formed a long-term top, he thinks no definitive conclusion is possible yet. Historically, on average, gold tends to bottom in summer during mid-term years, with the weak stretch roughly between June and October, before rising again. He leans toward the view that gold may still hit new highs before the decade ends, but if it fails to break out of a key range by mid-2027, he would agree the top has formed.
On US stocks, he notes that mid-term years typically see two pullbacks, one early in the year and one late in the year, as happened in 2014, 2018, and 2022. Bitcoin's cycle bottom often appears during the S&P's second pullback.
He does not expect a major crash like the dot-com bust now, but leans toward a smaller pullback before year-end—enough to make market sentiment nervous. He thinks the business cycle may still have one to two years of room, citing factors such as large IPOs not yet clustering and the unemployment rate trending down since last November.
He also mentions interest rates: if the Fed hikes before year-end, it could trigger a brief stock pullback, but a rate cut cycle itself means the economy is still okay and does not equal an economic collapse.
All of the above are the interviewed analyst's personal views and historical observations and do not constitute investment advice. Any strategy should be judged independently in light of your own risk tolerance.
This article is produced by the MSXGO editorial team, AI-assisted, and reviewed through an editorial process. Fee rates and figures are subject to each platform's latest official announcements.
Finished reading? Ready to try trading?
Tokenized stocks/ETFs, crypto spot, and perpetual futures in one account — perp maker 0.02% / taker 0.045%, RWA spot buy 0.3% / sell 0.
Free sign-up · 3 quick steps