MSX US Stocks Daily Watch: AMD Data Center Revenue Nearly Doubles to 64% of Sales; $17B Q4 Guidance Tops Estimates, Shares Rise 7% After Hours
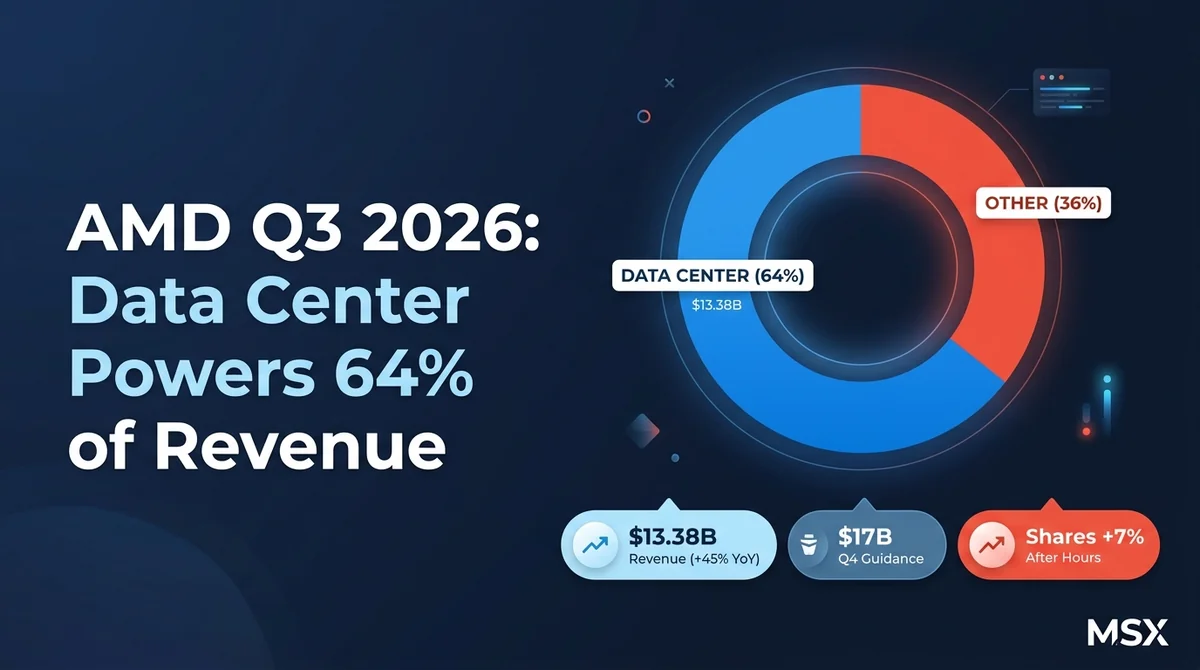
AMD Q3 revenue $13.38B, up 45% YoY; data center nearly doubles to 64% of sales; Q4 guide of $17B beats; shares up 7% after hours. Also: Realty Income funding mix and VLUE concentration risk.
Article Citation Summary
AMD Q3 revenue $13.38B, up 45% YoY; data center nearly doubles to 64% of sales; Q4 guide of $17B beats; shares up 7% after hours. Also: Realty Income funding mix and VLUE concentration risk.
MSX US Stocks Daily Watch: AMD Data Center Revenue Nearly Doubles to 64% of Sales; $17B Q4 Guidance Tops Estimates, Shares Rise 7% After Hours
MSX Research
Guest Columnist
@MSX_CN
November 2026
This article is about 5,000 words and takes about 13 minutes to read
The real weight of an earnings release often lies not in the numbers it has already delivered, but in how far forward it pushes visibility into the next quarter. AMD's answer for the third quarter of 2026 was direct: according to CNBC, revenue came in at $13.38 billion, up 45% year over year, with adjusted EPS of $2.09, both beating Wall Street expectations. More structurally significant: data center revenue nearly doubled year over year, and its share of total revenue jumped to 64% from 47% a year earlier. When a company's revenue center of gravity shifts from less than half to nearly two-thirds, the variables the market references when discussing its valuation change as well — from the cyclical swings of PCs and consumer electronics to the long-cycle narrative of compute capital expenditure. Two other institutional developments the same day deserve to be read alongside it: according to Seeking Alpha, Realty Income cut public equity financing from about 60% in 2023 to 19% so far in 2026, while VLUE's outperformance of the S&P 500 over the past 12 months came mainly from a single stock, MU, at a 19.23% weight. All three threads point to the same thing: the core variable in current US equity pricing may be growth visibility and capital structure more than any single quarter's numbers.
AI Summary
Core view: AMD used $13.38 billion in revenue, a 64% data center revenue share and $17 billion in Q4 guidance to anchor its growth narrative in compute infrastructure; meanwhile, Realty Income's shift in financing tools and VLUE's dependence on a single name suggest that capital structure and index concentration are being re-examined in parallel.
Key elements:
- According to CNBC, AMD reported third-quarter 2026 results with revenue of $13.38 billion, up 45% year over year, and adjusted EPS of $2.09, both beating Wall Street expectations.
- According to CNBC, AMD's data center revenue nearly doubled year over year and accounted for 64% of total revenue, up from 47% a year earlier.
- According to CNBC, AMD expects fourth-quarter revenue of about $17 billion, above the analyst average estimate of $16.2 billion, with gross margin expected at 55%.
- According to CNBC, AMD shares rose 7% in after-hours trading following the earnings release, bringing year-to-date gains to about 125%.
- According to Seeking Alpha, Realty Income's financing mix has shifted from heavy stock issuance to more euro debt, convertible notes, joint ventures and asset sales; public equity accounted for only 19% of financing so far in 2026, versus about 60% in 2023.
- According to Seeking Alpha, Realty Income currently trades at a P/E ratio of 12.9x guided AFFO with a 5.7% dividend yield, and its intrinsic value is estimated at $65 to $70 (that estimate is analytical judgment, not company disclosure).
- According to Seeking Alpha, the iShares MSCI USA Value Factor ETF (VLUE) has beaten the S&P 500 over the past 12 months, with its excess return coming mainly from a single stock, MU, which carries a 19.23% weight in the fund.
1. AMD's Q3 Results Beat Broadly, With Data Center the Absolute Growth Engine
1. Revenue of $13.38 Billion, Up 45% Year Over Year, and Adjusted EPS of $2.09 Both Beat Expectations
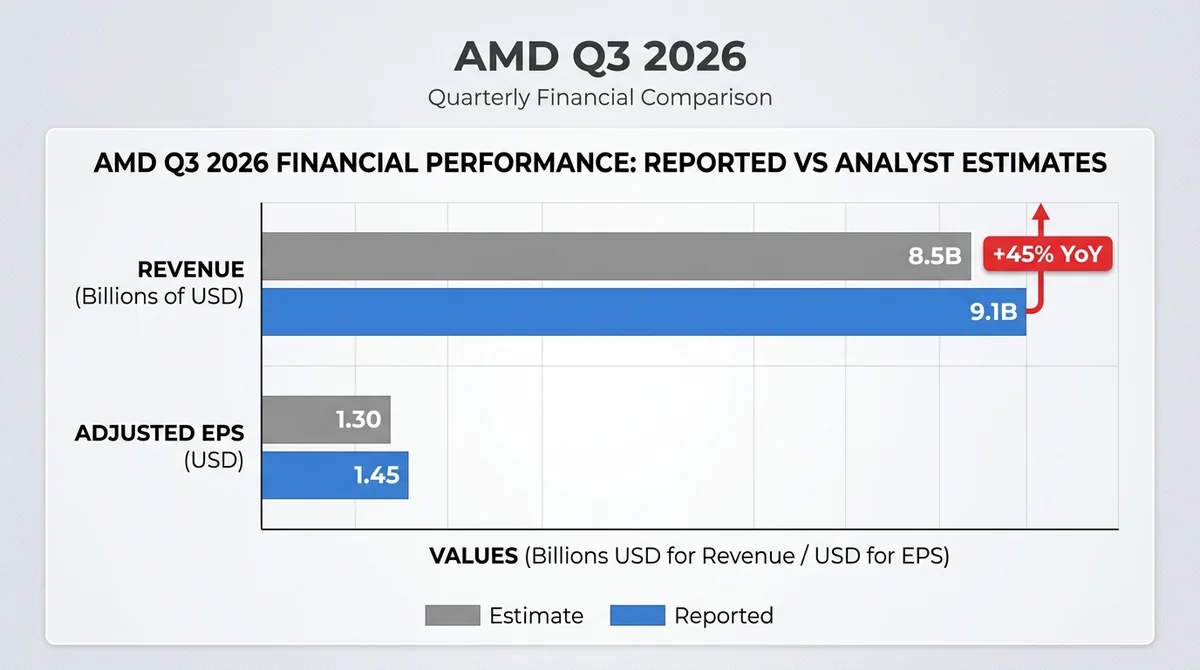
According to CNBC, in the third-quarter results AMD published on November 3, 2026, it delivered a set of numbers that cleared expectations on both revenue and profit: revenue of $13.38 billion, up 45% year over year, and adjusted EPS of $2.09, both above Wall Street expectations.
In the semiconductor industry, few companies can sustain single-quarter revenue growth above 40%, especially when their scale has already entered the hundred-billion-dollar annualized range. A 45% year-over-year rate means AMD's growth is not mainly driven by base effects; demand itself is expanding. Adjusted EPS of $2.09 shows that this expansion did not come at the expense of earnings quality — revenue growth and profit growth moved in the same direction in the same quarter.
For the market, the significance of this combination is that it answers two questions at once: whether growth is still there, and whether growth is profitable. When a company at the center of the compute race can deliver both high growth and positive profit, the focus of valuation discussion shifts from "can it deliver" to "how long can it deliver."
2. Data Center Revenue Nearly Doubled Year Over Year, With Revenue Share Jumping From 47% to 64%
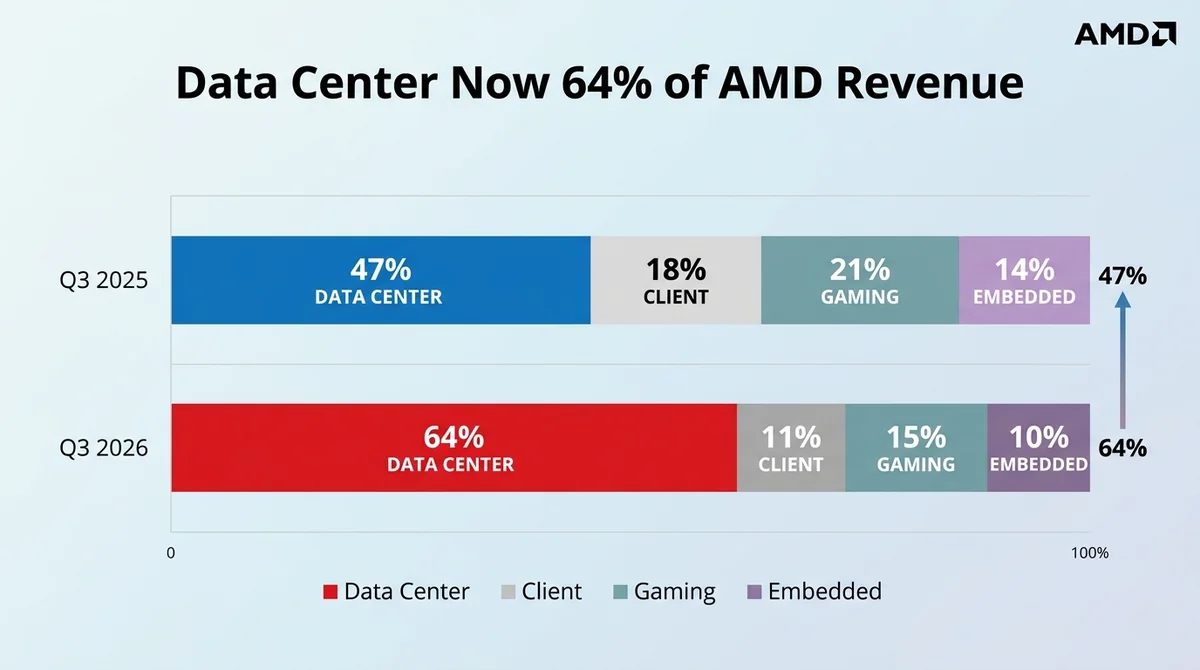
More worth reading word by word than revenue and EPS is the change in business mix. According to CNBC, AMD's data center revenue nearly doubled year over year and accounted for 64% of total revenue, up from 47% a year earlier.
From 47% to 64% is a 17-percentage-point migration. Completing that in a single year shows that growth was not broad-based across segments but a concentration of resources and revenue toward one direction. Data center revenue nearly doubling year over year means the segment grew faster than the company's overall 45% revenue growth — precisely because this line ran faster, its share was pushed up quickly.
This structural change in turn affects how outsiders classify the company. When data center accounted for less than half of revenue, AMD was still habitually discussed within the cyclical framework of PCs and consumer electronics; when that share rises to nearly two-thirds, the company's revenue curve is bound more to the compute procurement rhythm of cloud providers and enterprises than to the PC replacement cycle.
3. The Shift in Business Mix Means AMD's Valuation Anchor May Have Moved From the PC Cycle to the Compute Capex Cycle
Putting the first two points together, the most structurally significant thing about this earnings release is not the phrase "beat expectations" but the reordering of revenue composition. Data center rising from less than half to nearly two-thirds essentially replaces the main driver of the company's results.
That replacement has a direct impact on valuation methods. Under the consumer electronics cycle, valuation focuses more on inventory, replacement rhythm and price wars, with shorter-term sources of volatility; under the compute capex cycle, valuation focuses more on customer capex budgets, order visibility and supply ramp, with medium-term sources of volatility. If the data center share stays above 60%, the market's pricing logic for AMD may move further toward infrastructure-type assets. It should be noted that this is an inference based on the earnings structure, not a conclusion already validated by the market.
It is worth emphasizing that structural concentration is itself a double-edged sword. The higher the share, the more sensitive the company is to a single demand direction; once compute procurement slows in a given phase, the elasticity of the revenue curve amplifies accordingly. This point should not be omitted when discussing the growth story.
2. Q4 Guidance of $17 Billion Beats Expectations, With 55% Gross Margin Outlining Earnings Quality
1. Fourth-Quarter Revenue Guidance of About $17 Billion, Above the Analyst Average of $16.2 Billion
AMD's fourth-quarter guidance was the second focus of this earnings release. According to CNBC, the company expects fourth-quarter revenue of about $17 billion, above the analyst average estimate of $16.2 billion.
The gap between $17 billion and $16.2 billion is $800 million. On a base where single-quarter revenue has already reached $13.38 billion, this guidance implies further sequential growth. Guidance above consensus is usually read as the company having better internal order visibility than sell-side models assume — sell-side models tend to be conservative, while management holds earlier order and delivery schedules.
More important is the time span. The Q3 beat only proves the three months just passed; the Q4 guidance extends visibility into the next quarter. For a compute supplier in the capacity ramp phase, whether it can give forward guidance above expectations often reflects the true tightness of supply and demand better than a single quarter's results.
2. Gross Margin Expected at 55%, With a High-Margin Mix Supporting the Sustainability of the Data Center Narrative
Alongside revenue guidance came a 55% gross margin forecast. According to CNBC, AMD expects a fourth-quarter gross margin of 55%.
Gross margin is a ruler for testing growth quality. If revenue expansion is achieved by cutting prices to move volume, gross margin gets diluted; if expansion comes with gross margin held high, it shows the product mix is moving toward higher value. The 55% gross margin forecast corroborates the structural shift of data center to 64% of revenue — a higher share of high-value compute products supports margin stability.
For the market, the value of this information is that it weakens concerns about "trading price for volume." In an environment of intensifying compute supply competition, the market's biggest fear is vendors sacrificing price to fight for share; the 55% gross margin forecast at least sends the opposite signal at the guidance level.
3. The Raised Guidance Matters More Than the Single-Quarter Beat, Confirming Order Visibility Extends Into the Next Quarter
Putting Q3's actual numbers and Q4 guidance on the same table yields a clearer judgment: the core message of this earnings release is "visibility," not "surprise."
A single-quarter beat leaves plenty of room for interpretation — it could come from delivery timing pulled forward, or from a one-off product mix optimization; guidance above consensus, by contrast, points to demand not being interrupted at the quarter boundary. For an expanding compute business line, the latter is relatively harder evidence.
From this, a somewhat subjective judgment follows: if AMD can continue to give guidance above consensus in subsequent quarters, the market's adjustment of its valuation framework may become further entrenched; conversely, if guidance converges with expectations, even if single-quarter numbers remain strong, pricing sensitivity may decline. Guidance has become one of the most important communication variables for this company.
3. A 7% After-Hours Gain and Roughly 125% Year-to-Date Rise Reflect How the Market Prices the Compute Narrative
1. Shares Rose 7% in After-Hours Trading After the Earnings Release, With Year-to-Date Gains of About 125%
The market's immediate feedback is also worth recording. According to CNBC, AMD shares rose 7% in after-hours trading following the earnings release, bringing year-to-date gains to about 125%.
These two numbers need to be read together. A year-to-date gain of about 125% means that before the earnings release, the market had already paid a fairly high price for this compute narrative; on top of such gains, a further 7% move after hours shows the information content of the release exceeded what had already been priced in.
In other words, the 7% looks more like a repricing of the future than a reward for the past. In the relatively limited-liquidity after-hours session, the market used a 7% move to express approval of the fourth-quarter guidance and the data center mix.
2. High-Flying Names Tend to Be More Sensitive to Guidance Than to Single-Quarter Results
The bigger the gain, the more sensitive pricing usually is to forward-looking information. The reason is not complicated: when the share price already reflects a lot of optimistic assumptions, a single quarter "in line with expectations" generates almost no new information, and what actually moves the price are variables that revise the future cash flow path.
That is exactly the case with AMD this time. Revenue of $13.38 billion and EPS of $2.09 matter, but they describe a quarter that has already happened; the $17 billion Q4 guidance and 55% gross margin forecast describe quarters that have not. With the stock up about 125% year to date, the latter is the source of marginal information.
This also means that volatility in such names in subsequent quarters will be concentrated more in the guidance stage than in the results stage. For observers, the tracking focus should shift accordingly to changes in guidance and order visibility.
3. The Share Price Reaction Reflects a Repricing of Data Center Durability, Not a One-Off Reward for Results
Putting the 7% after-hours move together with the 64% data center share yields a fuller interpretation: what the market may be pricing is the durability of this business line, not a single quarter's report card.
If the market believed data center's high growth was one-off, the after-hours reaction would have been relatively restrained even with a single-quarter beat; the 7% gain suggests participants lean toward the view that data center revenue nearly doubling year over year will continue in the fourth quarter — which happens to be mutually supported by the $17 billion revenue guidance.
Caution is warranted: after-hours trading has a limited sample and low liquidity, so the 7% move should not be extrapolated directly as a long-term trend. It is more of a signal that the market's acceptance of the "compute capex cycle" narrative framework is rising.
4. Two Institutional Developments the Same Day: Realty Income's Financing Shift and VLUE's Concentration Concern
1. Realty Income's Public Equity Financing Fell From About 60% in 2023 to 19% So Far in 2026
Beyond AMD's earnings, another piece of information about capital structure the same day is worth recording. According to Seeking Alpha, Realty Income's financing mix has shifted from heavy stock issuance to more euro debt, convertible notes, joint ventures and asset sales; public equity accounted for only 19% of financing so far in 2026, versus about 60% in 2023.
From about 60% to 19% is a substantive reshuffling of the financing toolbox. For a REIT whose dividend is a key attraction, public equity financing is the most direct but also the most dilutive tool; shifting to euro debt, convertible notes, joint ventures and asset sales means the company has re-weighed equity dilution against financing cost.
Such trade-offs are especially common when the rate environment shifts. Issuing equity dilutes EPS and dividends per share, while debt instruments bring interest burdens but preserve per-share continuity. The choice of financing structure is essentially a judgment on which is more expensive: dilution cost or cost of capital.
2. Its P/E Ratio Is 12.9x Guided AFFO, Dividend Yield Is 5.7%, and Intrinsic Value Is Estimated at $65 to $70
Alongside the financing mix came a set of valuation metrics. According to Seeking Alpha, Realty Income currently trades at a P/E ratio of 12.9x guided AFFO with a 5.7% dividend yield, and its intrinsic value is estimated at $65 to $70.
For REITs, AFFO (adjusted funds from operations) reflects cash generation better than GAAP EPS, so using 12.9x guided AFFO as the P/E ratio basis is the more common way to look at this asset class. The 5.7% dividend yield offers another dimension of reference — in an environment of fluctuating rates, the level of the dividend yield directly affects the attractiveness of such assets relative to fixed-income products.
Putting the financing mix and valuation data together yields a logical chain: when public equity financing is compressed to 19%, per-share continuity is protected, and the sustainability of the dividend yield gains some support; the $65 to $70 intrinsic value estimate provides a reference coordinate against the current price. It should be noted that the intrinsic value estimate is analytical judgment, not company-disclosed data, and has not been independently verified.
3. VLUE Beat the S&P 500 Over the Past 12 Months, but the Excess Return Came Mainly From MU at a 19.23% Weight
The third piece of information the same day concerns a passive product. According to Seeking Alpha, the iShares MSCI USA Value Factor ETF (VLUE) has beaten the S&P 500 over the past 12 months, with its excess return coming mainly from a single stock, MU, which carries a 19.23% weight in the fund.
The value of this information lies in the gap it reveals between name and exposure. A product named for the value factor has beaten its benchmark over the past 12 months mainly thanks to a single name; and a 19.23% weight means the fund's NAV curve is tied to a considerable degree to the share price of one semiconductor memory company.
This does not amount to a rejection of the product design, but it points to a common cognitive bias: investors often infer risk exposure from a product's name, while actual exposure is determined by the weight structure. When a single name approaches one-fifth of the fund, the explanatory power of the factor label is significantly weakened, and the fund's actual volatility profile may be closer to a concentrated portfolio.
5. What the Three Threads Point To: Capex Expansion and a Financing Structure Shift Happening at the Same Time
1. Compute-Driven Revenue Expansion and REITs' Diversification of Financing Tools Belong to the Same Rate and Capital Environment
AMD's data center revenue expansion and Realty Income's diversification of financing tools appear to belong to two unrelated industries, but observed within the same time window, they may share the same set of macro conditions.
On one side, compute capex is driving rapid revenue expansion, and companies are willing to pay a premium for growth; on the other, high-dividend assets are seeking a new balance between financing cost and equity dilution, cutting public equity financing from about 60% to 19%. The former reflects capital flowing to growth assets; the latter reflects income assets adjusting themselves under funding-cost constraints.
Together they show that the current capital environment is neither uniformly loose nor uniformly tight, but structurally divergent: areas with high growth certainty can obtain capital with lower friction, while rate-sensitive assets need more complex tool combinations to maintain spreads. It should be noted that this generalization is a cross-case inference, and the two threads may not have a direct causal relationship.
2. When a Passive Product's Excess Return Is Highly Concentrated in a Single Name, the Explanatory Power of the Style Label Weakens
The VLUE case offers a methodological reminder. When a style product's excess return comes mainly from a single name at a 19.23% weight, the portion of returns the "value factor" label can explain is compressed.
This imposes a specific requirement on observers: when evaluating passive products, the weight structure matters no less than the product name. Especially during style rotations, highly concentrated products may exhibit volatility characteristics inconsistent with their labels — they may amplify gains when the style is favorable, and amplify drawdowns when the single name corrects.
This reminder echoes the AMD case: whether active stock selection or passive allocation, the real risk exposure is determined by structure, not by narrative.
3. For Investors, Guidance, Financing Structure and Index Concentration Are Three Variables to Track Simultaneously
Bringing the three threads together yields three variables to keep tracking.
First, guidance. The AMD case shows that for a stock that has already risen sharply, guidance rather than historical results may be the marginal pricing variable; the $17 billion Q4 guidance and 55% gross margin forecast will be tested in the next earnings season.
Second, financing structure. Realty Income has cut public equity financing to 19%, a choice that protects per-share metrics while increasing reliance on debt and joint-venture tools; subsequent changes in its financing costs are worth watching.
Third, index concentration. VLUE's excess return depends on MU at a 19.23% weight, a reminder that a passive product's actual exposure should be judged by weight rather than name. These three variables sit at different levels, but all point to the same methodology: look at structure, not just numbers.
Final Thoughts
According to CNBC, AMD used $13.38 billion in revenue, a 64% data center revenue share and $17 billion in Q4 guidance to anchor its growth narrative in compute infrastructure. What may be most memorable about this earnings release is not the size of the beat but the migration of the revenue center of gravity — the 17 percentage points from 47% to 64% change the framework the market references when valuing this company. When data center approaches two-thirds of revenue, AMD's results curve syncs more with the rhythm of compute capex than with the consumer electronics replacement cycle.
According to Seeking Alpha, Realty Income's public equity financing fell from about 60% to 19%, showing that high-dividend assets are using more complex tools to maintain spreads. The combination of euro debt, convertible notes, joint ventures and asset sales is essentially a reordering of equity dilution against financing cost; the 12.9x AFFO P/E ratio and 5.7% dividend yield provide the coordinates for judging whether that choice pays off.
According to Seeking Alpha, VLUE's excess return over the S&P 500 came mainly from MU at a 19.23% weight, a reminder that a passive product's name does not equal its real exposure. This matters especially during style rotations — when a single name approaches one-fifth of the fund, the portion the factor label can explain is greatly compressed, and the fund's actual volatility profile is closer to a concentrated portfolio.
Taken together, the three threads suggest that the key variables in this market cycle may be guidance and structure rather than single-quarter numbers. Compute capex expansion and the financing structure shift are happening in the same time window: the former affects the pricing ceiling for growth assets, the latter affects the spread space for income assets, and passive product concentration determines the real risk distribution at the portfolio level. For observers, shifting attention from single-quarter results to guidance, financing structure and weight structure may be a more effective entry point for understanding the pricing logic of US equities at this stage.
Risk disclosure: Macroeconomic and US equity market conditions are highly volatile. This content is provided solely for academic and research observation reference by MSX Research and does not constitute any investment advice.
Invest in AI RWA Finance
References
This article is produced by the MSXGO editorial team, AI-assisted, and reviewed through an editorial process. Fee rates and figures are subject to each platform's latest official announcements.
FAQ
What are the core figures in AMD's third-quarter 2026 earnings? ▼
According to CNBC, AMD's third-quarter 2026 revenue was $13.38 billion, up 45% year over year, with adjusted EPS of $2.09, both beating Wall Street expectations; data center revenue nearly doubled year over year and accounted for 64% of total revenue, up from 47% a year earlier.
What is AMD's guidance for the fourth quarter? ▼
According to CNBC, AMD expects fourth-quarter revenue of about $17 billion, above the analyst average estimate of $16.2 billion, with gross margin expected at 55%.
How did AMD's share price react after the earnings release? ▼
According to CNBC, AMD shares rose 7% in after-hours trading following the earnings release, bringing year-to-date gains to about 125%; after-hours liquidity is limited, so the move should not be extrapolated directly as a long-term trend.
How has Realty Income's financing structure changed? ▼
According to Seeking Alpha, Realty Income's financing mix has shifted from heavy stock issuance to more euro debt, convertible notes, joint ventures and asset sales; public equity accounted for only 19% of financing so far in 2026, versus about 60% in 2023.
Why did VLUE beat the S&P 500 over the past 12 months? ▼
According to Seeking Alpha, the iShares MSCI USA Value Factor ETF (VLUE) has beaten the S&P 500 over the past 12 months, with its excess return coming mainly from a single stock, MU, which carries a 19.23% weight in the fund; this statement comes from a single source and the specific attribution has not been independently verified.
Finished reading? Ready to try trading?
Tokenized stocks/ETFs, crypto spot, and perpetual futures in one account — perp maker 0.02% / taker 0.045%, RWA spot buy 0.3% / sell 0.
Free sign-up · 3 quick steps