MSX US Stock Daily Watch: KPN, Wells Fargo and Aker BP — KPN FCF Guidance Implies 6% Dividend Yield, Wells Fargo Preferred Offers 7% Yield Opportunity, Aker BP Downgraded
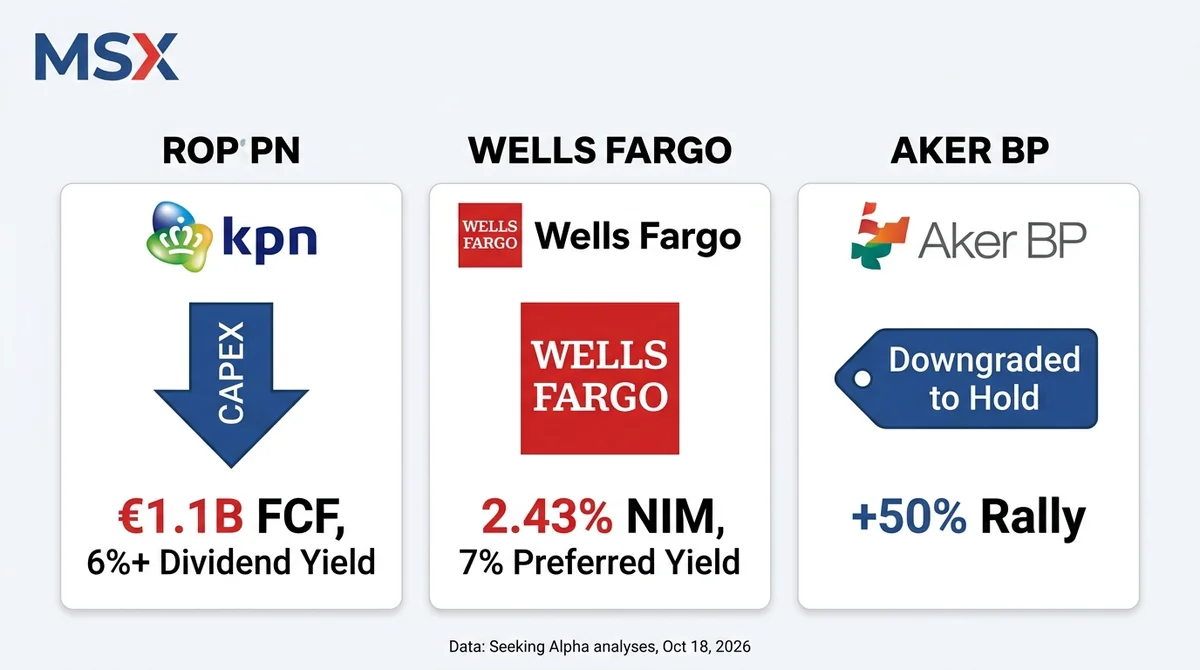
KPN guidance implies €1.1B 2027 free cash flow and over 6% dividend yield; Wells Fargo Q3 NIM 2.43%, net interest income $12.5B; Aker BP cut to Hold after ~50% rally.
Article Citation Summary
KPN guidance implies €1.1B 2027 free cash flow and over 6% dividend yield; Wells Fargo Q3 NIM 2.43%, net interest income $12.5B; Aker BP cut to Hold after ~50% rally.
MSX US Stock Daily Watch: KPN, Wells Fargo and Aker BP — KPN FCF Guidance Implies 6% Dividend Yield, Wells Fargo Preferred Offers 7% Yield Opportunity, Aker BP Downgraded
MSX Research
Guest Columnist
@MSX_CN
October 18, 2026
This article is about 5,000 words and takes about 12 minutes to read
When the capex cycle peaks and rolls over, net interest margins stabilize in a rate plateau, and cyclical stocks have outrun their asset advantages, the pricing signals from the market are highly consistent: cash flow visibility is replacing earnings elasticity as the core pricing power for dividend and income assets. KPN trades a 20% capex reduction through 2027 for €1.1 billion in free cash flow and a dividend yield above 6% implied by its 2027 guidance; Wells Fargo supports a 7% preferred stock yield opportunity with a 2.43% net interest margin, $12.5 billion in net interest income and a 69% loan-to-deposit ratio; Aker BP is downgraded to Hold after a roughly 50% share price rally — three analytical views published on the same day all point to the same theme.
It should be noted that the specific figures cited in this article all come from three Seeking Alpha analytical articles published on October 18, 2026; the 2027 KPN data is company guidance and constitutes a forward-looking forecast rather than realized results.
AI Summary
Core view: KPN's free cash flow guidance, Wells Fargo's stable net interest margin and Aker BP's downgrade represent three forms of cash flow respectively — structural cash flow improvement, steady-state cash flow, and cyclical cash flow disturbed by demand-side factors; during the earnings divergence phase of October 2026, the market's pricing weight on cash flow predictability may rise, which would affect the relative appeal of dividend and income assets.
Key elements:
- KPN is emerging from a high-capex cycle, with capex expected to fall 20% by 2027 and drive significant free cash flow growth.
- KPN targets 3% compound annual growth in revenue and EBITDAaL, and 7% compound annual growth in free cash flow.
- KPN's 2027 guidance implies €1.1 billion in free cash flow and a dividend of €0.25 per share, a dividend yield above 6% at the current price.
- Wells Fargo reported mixed third-quarter results: EPS beat expectations but revenue missed, and the stock was flat for the week.
- Wells Fargo's third-quarter net interest margin held at 2.43%, with net interest income up $200 million to $12.5 billion.
- Wells Fargo's third-quarter loans rose 1.7% quarter over quarter and 11% year over year, deposits edged higher, and the loan-to-deposit ratio held at 69%.
- Aker BP is a North Sea-focused oil company that benefits from proximity to European markets; its share price has risen about 50% since the previous article.
- With demand destruction threats and rising recession risk, the analyst downgraded Aker BP to Hold.
1. KPN Emerges from a High-Capex Cycle: 2027 Guidance Implies €1.1 Billion Free Cash Flow and a Dividend Yield Above 6%
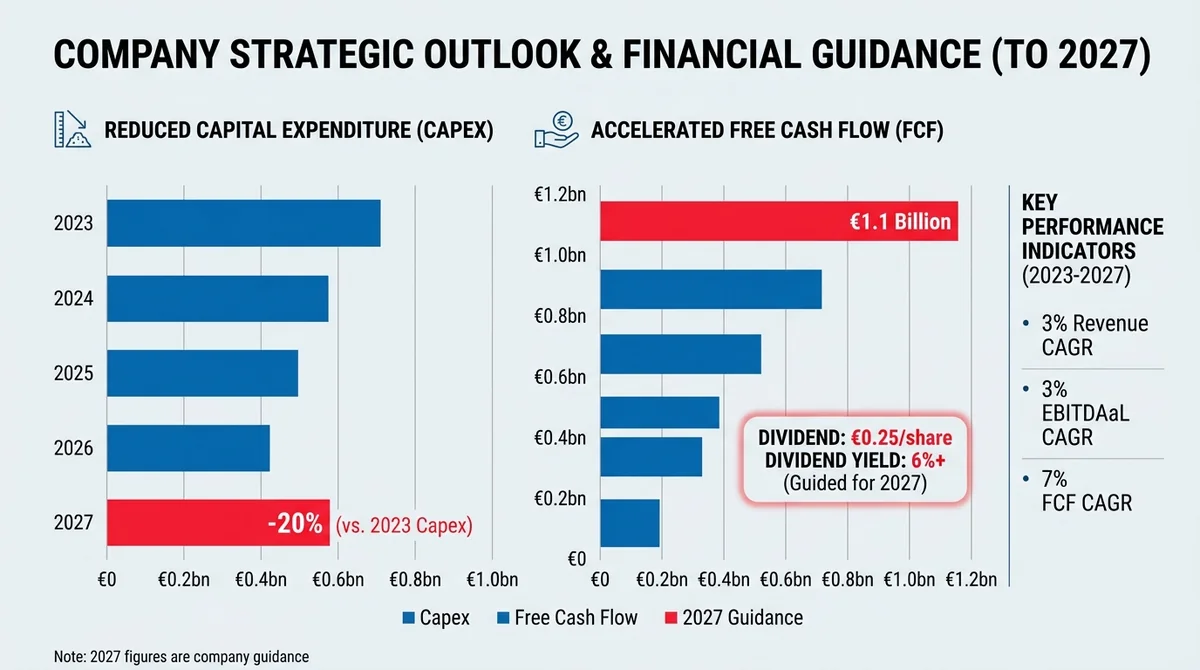
The position in the capex cycle often determines the valuation center of a telecom operator asset more than current earnings. The signal KPN is currently giving is that the high-investment phase is winding down and the cash flow release phase is about to begin. According to a Seeking Alpha analysis published on October 18, 2026, KPN is emerging from a high-capex cycle, with capex expected to fall 20% by 2027 and drive significant free cash flow growth. For a telecom operator whose core assets are network infrastructure, a 20% capex reduction means depreciation pressure and cash outflows ease in tandem, and the improvement in free cash flow is structural rather than one-off.
The importance of this judgment lies in the fact that operator assets have long been priced by the market as "heavy assets, low growth"; if the capex downcycle is confirmed, the valuation framework may shift from EV/EBITDA to free cash flow yield. KPN's 2027 guidance implies €1.1 billion in free cash flow and a dividend of €0.25 per share, a dividend yield above 6% at the current price — a yield level sufficient to attract income-oriented capital in the current rate environment.
1. KPN Capex to Fall 20% by 2027, Free Cash Flow Set for Significant Growth
A 20% capex reduction is the first cornerstone of KPN's cash flow narrative. Telecom operators' capex typically shows clear cyclicality: cash outflows are huge during network build-out peaks, and depreciation and amortization suppress reported profit; after construction is completed, capex falls and free cash flow expands. KPN expects capex to fall 20% by 2027, meaning this build-out cycle is nearing its end and a cash flow inflection point may be forming.
In market terms, the free cash flow growth brought by a capex decline is usually valued more by income investors than revenue growth, because the former maps more directly to distributable cash. If capex falls as guided, KPN's dividend capacity will come more from the natural release of operating cash flow rather than balance sheet expansion, which matters more for dividend sustainability than the single-year dividend yield figure.
2. 3% Revenue and EBITDAaL CAGR and 7% Free Cash Flow CAGR Form the Guidance Base
KPN targets 3% compound annual growth in revenue and EBITDAaL, and 7% compound annual growth in free cash flow. The structure of this target set is noteworthy: free cash flow growth (7%) is significantly higher than revenue and EBITDAaL growth (3%), and the gap points to the combined effect of capex decline and operating leverage.
In other words, KPN's guidance is not built on accelerating growth but on a combination of "moderate growth + capex decline." This guidance structure is relatively insensitive to the macro environment: even if revenue growth only reaches the low end of guidance, as long as capex falls as planned, free cash flow can still achieve 7% compound annual growth. This may be the key reason KPN is being re-examined by income-oriented capital at this stage.
3. €0.25 Per Share Dividend in 2027 Corresponds to a Yield Above 6%, High-Dividend Narrative Repriced
KPN's 2027 guidance implies €1.1 billion in free cash flow and a dividend of €0.25 per share, a dividend yield above 6% at the current price. In the 2026 market environment, a dividend yield above 6% is quite attractive for income assets, especially when that yield is backed by free cash flow guidance rather than reliance on one-off asset disposals or debt expansion.
The logic of repricing the high-dividend narrative is that the market is willing to pay a premium for "predictable cash flow." KPN's dividend yield does not come from a passive lift from a falling share price but from the active release of free cash flow during a capex downcycle. If the 2027 guidance is delivered as expected, KPN's valuation anchor may shift from current earnings multiples to forward free cash flow yield, and this shift itself could bring a re-rating of the valuation center.
2. Wells Fargo's Mixed Third Quarter: 2.43% Net Interest Margin and $12.5 Billion Net Interest Income Support a 7% Preferred Stock Yield Opportunity
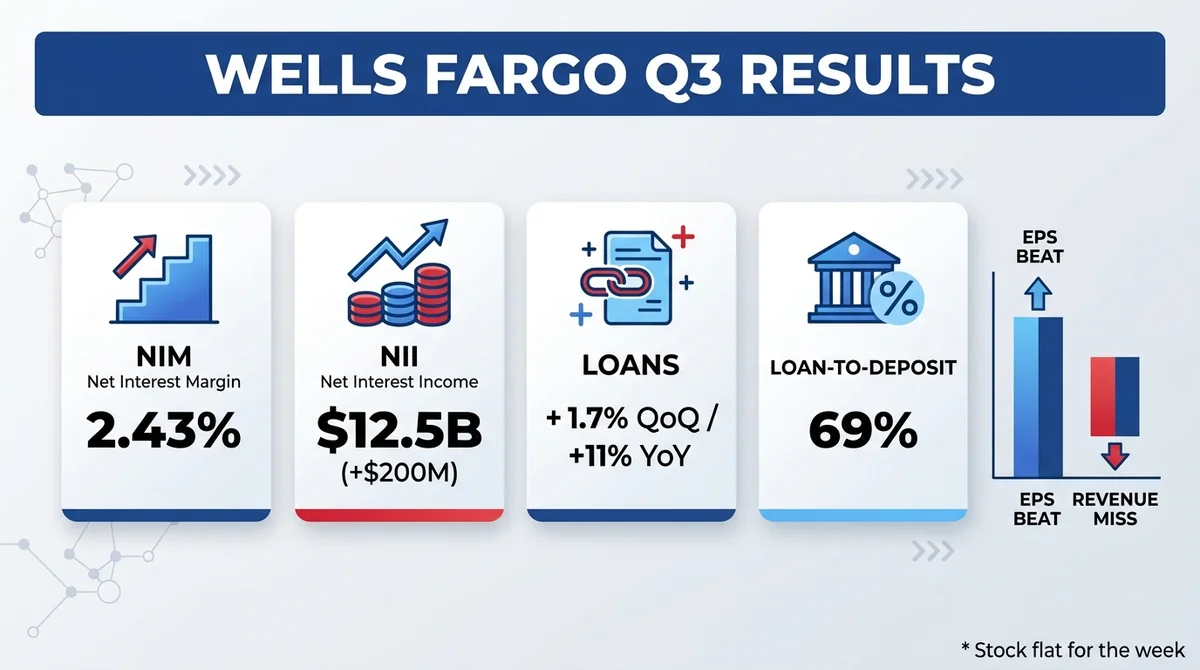
Unlike KPN's structural cash flow improvement, Wells Fargo presents another cash flow form: steady state. According to a Seeking Alpha analysis published on October 18, 2026, Wells Fargo reported mixed third-quarter results: EPS beat expectations but revenue missed, and the stock was flat for the week. This combination itself shows that the market's pricing of the report was relatively restrained — the earnings beat was offset by the revenue miss, and the stock made no directional choice.
Beneath the mixed headline, the balance sheet's core metrics remained stable: net interest margin held at 2.43%, net interest income rose $200 million to $12.5 billion, loans grew 1.7% quarter over quarter and 11% year over year, deposits edged higher, and the loan-to-deposit ratio held at 69%. For a large bank, this data set paints a picture of "stable earnings but no surprises," and it is precisely this stability that forms the basis for discussing the 7% preferred stock yield opportunity.
1. EPS Beat but Revenue Missed, Stock Flat for the Week
Wells Fargo's third-quarter EPS beat expectations but revenue missed, and the stock was flat for the week. For common shareholders, this result means limited earnings elasticity: the earnings beat may have come from cost control or reserve releases, while the revenue miss points to insufficient business expansion momentum. With the two offsetting each other, the market's reaction was a flat share price.
From an expectations-gap perspective, this report offered no catalyst for repricing. For investors seeking capital gains, the revenue miss is a signal to watch; but for income investors, a flat share price means the cost of buying the preferred stock did not rise significantly due to the report, and the value proposition of the yield opportunity was maintained.
2. Net Interest Margin Held at 2.43%, Net Interest Income Up $200 Million to $12.5 Billion
Wells Fargo's third-quarter net interest margin held at 2.43%, with net interest income up $200 million to $12.5 billion. A stable net interest margin is the core indicator of bank earnings stability: in a rate plateau, if the net interest margin holds, net interest income growth mainly comes from expansion of interest-earning assets rather than passive widening of spreads.
$12.5 billion in net interest income, combined with a 2.43% net interest margin, shows no significant deterioration in Wells Fargo's balance sheet structure. For preferred stock investors, net interest income is the first line of protection for dividend capacity — as long as the net interest margin does not narrow sharply, the coverage multiple for preferred dividends remains stable. This may be exactly why the market is shifting attention from common stock earnings elasticity to the preferred stock yield opportunity.
3. Loans Up 1.7% QoQ and 11% YoY, 69% Loan-to-Deposit Ratio Shows a Sound Balance Sheet
Wells Fargo's third-quarter loans rose 1.7% quarter over quarter and 11% year over year, deposits edged higher, and the loan-to-deposit ratio held at 69%. Loan growth of 11% year over year shows credit demand is still expanding, while the slight rise in deposits means no significant outflow pressure on the liability side, and together they support the 69% loan-to-deposit ratio.
A loan-to-deposit ratio held at 69%, below the range usually considered tight, shows Wells Fargo still has a sufficient deposit base to support asset expansion. For income investors, the significance of this metric is that a sound balance sheet means the bank does not need to rely on high-cost liabilities or asset sales to sustain dividends, giving additional protection to the sustainability of preferred dividends.
4. The Appeal of the 7% Preferred Stock Yield Opportunity Comes from Earnings Stability, Not Earnings Surprises
The 7% preferred stock yield opportunity contrasts with the mixed common stock results, as income investors shift focus from earnings elasticity to cash flow stability. This shift is not unique to Wells Fargo but a microcosm of the current market environment: when common stock earnings lack directional catalysts, fixed-income-like preferred stocks instead become the focus of the earnings season.
It should be clear that the appeal of the 7% preferred stock yield opportunity comes from earnings stability, not earnings surprises. If the net interest margin holds, net interest income is stable, and the loan-to-deposit ratio does not deteriorate significantly, preferred dividend coverage is predictable; but if revenue misses persist and eventually feed through to asset quality, the preferred stock yield opportunity would also be repriced. This is a conditional judgment that requires continuous tracking, not a risk-free return.
3. Aker BP Downgraded to Hold: After a Roughly 50% Rally, Demand Destruction and Recession Risk Cap Valuation Upside
Rating changes for cyclical stocks are often not a denial of asset quality but a recalibration of the risk-reward ratio. According to a Seeking Alpha analysis published on October 18, 2026, Aker BP is a North Sea-focused oil company that benefits from proximity to European markets; its share price has risen about 50% since the previous article, and the analyst downgraded Aker BP to Hold due to demand destruction threats and rising recession risk.
The tension in this set of facts is that the asset advantage and the downgrade hold simultaneously. North Sea oil assets are close to European markets, with short transport distances and relatively controllable geopolitical risk — this is Aker BP's relative advantage; but after a roughly 50% share price rally, this advantage has been largely reflected, while demand destruction and recession risk have become the more decisive marginal variables. The downgrade to Hold points to a change in the risk-reward ratio after the share price has fairly fully reflected the advantage.
1. North Sea Oil Assets Near European Markets Constitute Aker BP's Relative Advantage
Aker BP is a North Sea-focused oil company that benefits from proximity to European markets. This geographic advantage has practical significance in the energy sector: proximity to European consumer markets means shorter transport distances, lower logistics costs, and direct exposure to European energy demand. Against the backdrop of Europe's energy transition, the strategic value of North Sea oil assets cannot be ignored.
But an asset advantage is not the same as a valuation advantage. After the share price has already risen about 50%, the asset advantage has been largely priced by the market, and further gains require a new catalyst — and current demand-side signals do not support the emergence of such a catalyst.
2. Share Price Up About 50% Since the Previous Article, Gains Have Front-Run the Asset Advantage
Since the previous article, Aker BP's share price has risen about 50%. This gain is significant for a cyclical stock, meaning the market has already priced the relative advantage of North Sea assets fairly fully. From a risk-reward perspective, after a 50% gain, the marginal positives needed for further upside increase significantly, and if demand-side conditions turn unfavorable, the downside room also widens accordingly.
This explains why the downgrade has nothing to do with asset quality: the analyst downgraded the rating, not the judgment on the value of North Sea assets. After a roughly 50% share price rally, the risk-reward balance has shifted from "asset advantage driven" to "demand risk dominated," and the downgrade to Hold is the natural result of this change.
3. Demand Destruction Threats and Rising Recession Risk Prompt the Analyst to Downgrade to Hold
Due to demand destruction threats and rising recession risk, the analyst downgraded Aker BP to Hold. Demand destruction and recession risk are the two major suppressants for cyclical stock valuation: the former directly affects oil prices and sales volumes, while the latter affects overall risk appetite. Both rising at the same time means the cash flow visibility of cyclical stocks is declining.
Compared with KPN's structural cash flow improvement and Wells Fargo's steady-state cash flow, Aker BP represents a third form: cyclical cash flow disturbed by external demand-side factors. The downgrade to Hold is essentially the market applying a higher uncertainty discount to this type of cash flow. If demand destruction and recession risk continue to ferment, the rating elasticity of cyclical stocks may become more evident; if the risks fade, the rating could also swing back.
4. All Three Companies Point to the Same Theme: Cash Flow Visibility Determines Pricing Power for Dividend and Income Assets
Looking at KPN, Wells Fargo and Aker BP on the same day, one finds that although the three analyses belong to three different industries — telecom, banking and energy — they point to the same theme: cash flow visibility is determining the pricing power of dividend and income assets. KPN's high dividend is built on a 20% capex reduction and free cash flow growth, a case of structural cash flow improvement; Wells Fargo's 2.43% net interest margin, $12.5 billion net interest income and 69% loan-to-deposit ratio represent steady-state cash flow; Aker BP's downgrade stems from demand destruction threats and rising recession risk, a case of cash flow visibility disturbed by external factors.
The difference among the three is not the absolute level of dividend yield or yield but the predictability of cash flow. The market is willing to pay a premium for predictable cash flow and demands a discount for unpredictable cash flow — a pattern that was fairly evident during the earnings divergence phase of October 2026.
1. KPN's Dividend Yield Comes from Free Cash Flow Release Driven by Capex Decline
KPN's dividend yield does not come from a cyclical peak in earnings but from free cash flow release driven by capex decline. The 2027 guidance implies €1.1 billion in free cash flow and a dividend of €0.25 per share, a dividend yield above 6% at the current price. The characteristic of this structural improvement is sustainability: as long as capex falls as planned, the free cash flow release has continuity.
For the market, the significance of the KPN case is that it offers a "non-growth" dividend narrative: no revenue acceleration is needed, only a turn in the capex cycle, to support a relatively high dividend. This may be a typical path for operator assets being repriced in 2026.
2. Wells Fargo's Yield Opportunity Comes from Earnings Stability Supported by Net Interest Margin and Loan-to-Deposit Ratio
Wells Fargo's 7% preferred stock yield opportunity comes from earnings stability supported jointly by a 2.43% net interest margin, $12.5 billion in net interest income and a 69% loan-to-deposit ratio. Unlike KPN's structural improvement, Wells Fargo offers steady-state cash flow: no capex cycle inflection and no earnings surprises, but the balance sheet's core metrics remain stable.
The value of this steady state for income investors lies in predictability. When common stock results are mixed and the share price is flat for the week, the fixed-income characteristics of preferred stock instead become the focus of the earnings season. The shift in income investors' focus from earnings elasticity to cash flow stability is itself a reflection of changing market pricing weights.
3. Aker BP's Rating Change Shows Cyclical Assets' Cash Flow Visibility Is More Vulnerable to Demand-Side Disturbances
Aker BP's downgrade shows that the cash flow visibility of cyclical assets is more easily disturbed by demand-side factors. After a roughly 50% share price rally, the relative advantage of North Sea assets has been largely priced, while demand destruction threats and rising recession risk have become the more decisive marginal variables. The downgrade to Hold is a direct response to declining cash flow visibility.
Compared with KPN and Wells Fargo, Aker BP's cash flow form is the least stable: it depends neither on an endogenous inflection in the capex cycle nor on a steady net interest margin, but on the continued stability of the external demand environment. When cracks appear on the demand side, the rating elasticity of cyclical stocks quickly becomes evident.
4. Three Types of Signals Appearing on the Same Day Jointly Raise the Pricing Weight on Cash Flow Predictability
Together, the three analyses show that during the earnings divergence phase, the market is more willing to pay a premium for predictable cash flow. KPN's structural improvement, Wells Fargo's steady-state cash flow and Aker BP's disturbed cyclical cash flow form a pricing spectrum — from more predictable to less predictable, with the market's pricing weight declining in turn.
This pattern is instructive for understanding the current divergence between income and cyclical assets in US stocks. When macro uncertainty rises, assets with high cash flow visibility earn a premium and those with low visibility are required to offer a discount; when uncertainty fades, this weight may swing back. But as of October 2026, cash flow visibility is one of the important variables determining the pricing power of dividend and income assets.
Final Thoughts
KPN trades a capex decline for free cash flow and a dividend yield above 6%, a typical path for re-rating operator assets. A 20% capex reduction through 2027, a 7% free cash flow CAGR target, and guidance of €1.1 billion in free cash flow and a €0.25 per share dividend together form a dividend narrative that does not depend on revenue acceleration. The replicability of this path is worth noting: any asset-heavy industry at the tail end of its capex cycle could see similar cash flow release and valuation re-rating.
Wells Fargo's mixed report did not change its sound balance sheet characteristics, and the discussion of the 7% preferred stock yield opportunity centers on income rather than growth. A 2.43% net interest margin, $12.5 billion in net interest income and a 69% loan-to-deposit ratio outline steady-state cash flow rather than earnings elasticity. For income-oriented capital, the predictability of this steady state is itself value; but for capital seeking capital gains, the revenue miss remains a signal to watch.
Aker BP was downgraded to Hold after a roughly 50% rally, highlighting the rating elasticity of cyclical stocks in the face of demand destruction and recession risk. Asset advantage and a downgrade can hold simultaneously — the former is static asset quality, the latter is the dynamic risk-reward ratio. After the share price has fairly fully reflected the asset advantage, marginal demand-side changes become the dominant variable for the rating.
Taken together, the three cases suggest that cash flow visibility, capex cycle position and demand-side risk are important dividing lines for income and cyclical assets in US stocks today. During the earnings divergence phase, the market's pricing weight on predictable cash flow rises, and the discount required for unpredictable cash flow increases. This pattern is not limited to telecom, banking and energy but is one lens for observing current US equity asset pricing.
Risk warning: Macroeconomic and US equity market volatility is severe. This article is provided solely for academic and research observation by MSX Research and does not constitute any investment advice. Specific data in this article is cited from Seeking Alpha analytical articles; KPN's 2027 data is company guidance and may fall short of expectations.
This article is produced by the MSXGO editorial team, AI-assisted, and reviewed through an editorial process. Fee rates and figures are subject to each platform's latest official announcements.
FAQ
How much free cash flow and what dividend yield does KPN's 2027 guidance imply? ▼
According to Seeking Alpha analysis, KPN's 2027 guidance implies €1.1 billion in free cash flow and a dividend of €0.25 per share, a dividend yield above 6% at the current price; this data is company guidance and has not been item-by-item verified against official announcements.
How much will KPN's capex fall by 2027? ▼
According to Seeking Alpha analysis, KPN is emerging from a high-capex cycle, with capex expected to fall 20% by 2027 and drive significant free cash flow growth.
What were Wells Fargo's third-quarter net interest margin and net interest income? ▼
According to Seeking Alpha analysis, Wells Fargo's third-quarter net interest margin held at 2.43%, with net interest income up $200 million to $12.5 billion; the exact basis is subject to the company's financial reports.
How did Wells Fargo perform in the third quarter? ▼
According to Seeking Alpha analysis, Wells Fargo's third-quarter results were mixed: EPS beat expectations but revenue missed, and the stock was flat for the week.
Why was Aker BP downgraded to Hold? ▼
According to Seeking Alpha analysis, the analyst downgraded Aker BP to Hold due to demand destruction threats and rising recession risk; its share price had previously risen about 50% since the prior article.
What is Aker BP's asset advantage? ▼
Aker BP is a North Sea-focused oil company close to European markets, with shorter transport distances and relatively lower logistics costs — this is its relative advantage; but an asset advantage is not the same as a valuation advantage.
Finished reading? Ready to try trading?
Tokenized stocks/ETFs, crypto spot, and perpetual futures in one account — perp maker 0.02% / taker 0.045%, RWA spot buy 0.3% / sell 0.
Free sign-up · 3 quick steps