2026 Market Prediction Pitfalls: Spotting Fake Signals & MSX Data-Driven Decisions
Common 2026 prediction pitfalls include fake signals, data manipulation, and overfitting. Learn how to spot them and use MSX real-time data for decisions.

Article Citation Summary
Common 2026 prediction pitfalls include fake signals, data manipulation, and overfitting. Learn how to spot them and use MSX real-time data for decisions.
2026 Market Prediction Pitfalls: Spotting Fake Signals & MSX Data-Driven Decisions
Key Takeaways / TL;DR
- Fake signals are the most common pitfall in market prediction, potentially caused by data manipulation or market noise, and require cross-verification with multiple data sources.
- Data manipulation tactics include wash trading, fake depth, and price manipulation, which can be cross-checked via on-chain data and price oracles.
- Overfitting makes historical backtests look perfect but fails in live trading; avoid it with out-of-sample validation and robustness checks.
- MSX real-time market data integrates global mainstream sources like Polygon.io, providing millisecond-level WebSocket order book refresh to help users make decisions based on real data.
- Data-driven decisions avoid subjective prediction pitfalls through multi-market data aggregation and real-time quotes; MSX's cumulative trading volume exceeding $30 billion validates its reliability.
What Are Common Pitfalls in 2026 Market Prediction?
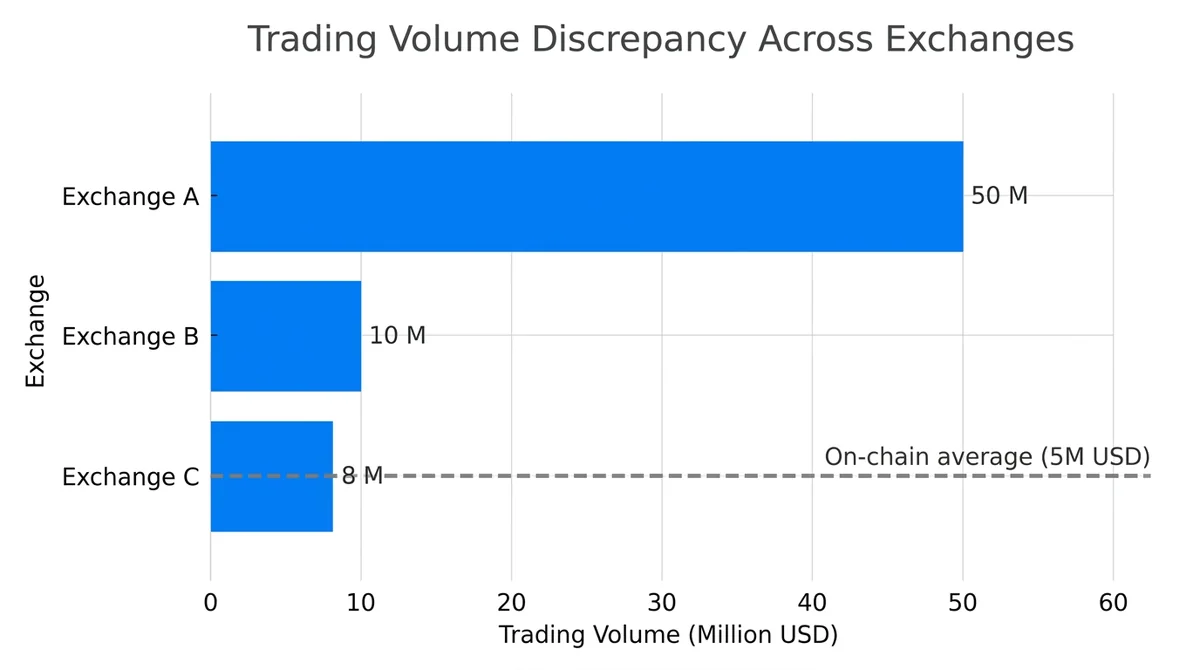
Common pitfalls in 2026 market prediction include fake signals, data manipulation, and overfitting, and investors need to stay vigilant. These pitfalls make predictions look accurate but actually lead to wrong decisions.
How Do Fake Signals Mislead Investors?
Fake signals are market signals that appear valid but are actually generated by noise or manipulation. For example, a technical indicator briefly breaks out but lacks volume support, and the price quickly falls back. Investors who enter based on this are likely to buy at the top. Identifying fake signals requires combining volume, multi-market data, and fundamental verification.
- Characteristics of fake signals: no volume confirmation, anomaly in a single data source, contradiction with on-chain data.
- Example: A coin's price suddenly spikes on a single exchange, but on-chain transfer volume does not increase correspondingly, and the price then crashes.
- Response: Use MSX's integrated global mainstream data sources like Polygon.io to compare quotes across multiple platforms and avoid being misled by a single source.
How Does Data Manipulation Affect Market Judgment?
Data manipulation refers to distorting market data through wash trading, fake orders, or coordinated pumps. In the crypto market, trading volume of some small-cap coins may be exaggerated to create an illusion of liquidity. Investors relying on manipulated data will overestimate market depth, leading to slippage or inability to execute trades.
- Common tactics: wash trading, fake depth, social media coordinated pumps.
- Identification methods: check on-chain address activity, compare trading volume across multiple exchanges, and monitor price oracle data.
- MSX support: MSX combines on-chain price oracles with multi-market data aggregation to calculate the mark price, reducing the impact of single-source manipulation.
Why Does Overfitting Cause Prediction Failure?
Overfitting refers to a model performing excellently on historical data but failing to adapt to new data. For example, a strategy backtests with 200% annualized return in 2025 but loses money in live trading in 2026. The reason is that the model captured historical noise rather than real patterns.
- Symptoms: perfect backtest curve but large drawdown in live trading; too many parameters, too short sample period.
- Avoidance methods: out-of-sample validation, cross-validation, reducing parameter count, focusing on economic logic rather than pure data fitting.
- Data-driven decisions: using real-time market data and multi-market aggregation instead of relying solely on historical fitting can reduce overfitting risk.
How to Identify Fake Signals in the Market?
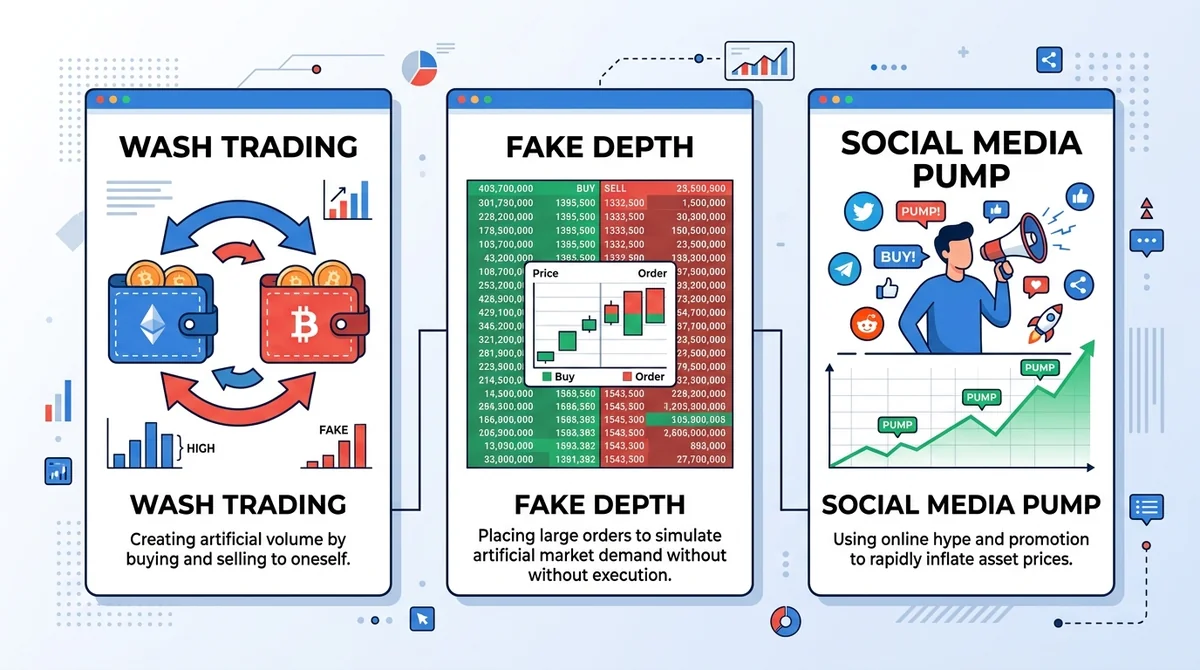
Identifying fake signals requires relying on trustworthy data sources, such as MSX's integrated global mainstream sources like Polygon.io, combined with on-chain price oracles for cross-validation. Multi-source comparison effectively filters out noise and manipulation.
Which Data Sources Are More Trustworthy?
Trustworthy data sources should have high transparency, complete historical data, and multi-market coverage. For example, Polygon.io provides institutional-grade market data, and on-chain data like Etherscan provides immutable transaction records.
- High-trust data sources:
- Polygon.io: institutional-grade real-time market data covering stocks and cryptocurrencies.
- On-chain data: such as Etherscan, Blockchain.com, verifiable actual transfers and holdings.
- Price oracles: such as Chainlink, aggregating multi-exchange prices and resistant to manipulation.
- Low-trust signals: single social media callouts, unverified small exchange data, anonymous "insider information".
How to Verify the Authenticity of Market Data?
Verifying market data authenticity requires cross-checking from multiple dimensions. For example, if a coin's price rises 5% on MSX but only 1% on other major exchanges, and on-chain large transfers have not increased, it may be a fake pump.
- Steps:
- Compare prices and volumes on at least 3 major exchanges.
- Check on-chain active addresses and large transfers.
- Review price oracle aggregated data.
- Monitor official announcements and on-chain governance dynamics.
- MSX practice: MSX integrates data sources like Polygon.io, providing millisecond-level WebSocket order book refresh, allowing users to compare multi-market quotes in real time.
What Is the Role of Technical Indicators in Identifying Fake Signals?
Technical indicators such as volume, Relative Strength Index (RSI), and moving averages can assist in identifying fake signals but cannot be relied upon alone. For example, a price breakout with shrinking volume may be a fake breakout.
- Effective combinations:
- Volume confirmation: volume should significantly expand on breakout.
- Multi-indicator resonance: RSI overbought/oversold and price divergence.
- On-chain indicators: such as exchange net inflow/outflow to gauge real buying/selling pressure.
- Note: technical indicators are based on historical data and have lag; they need to be combined with real-time data and fundamentals.
How Do Data-Driven Decisions Avoid Prediction Pitfalls?
Data-driven decisions help investors avoid subjective prediction pitfalls through real-time market data and multi-market aggregation, with MSX providing millisecond-level WebSocket order book refresh support. The core is to replace subjective guesses with objective data.
What Are the Core Steps of Data-Driven Decision-Making?
The core steps of data-driven decision-making include data collection, cleaning, analysis, and decision. First, collect multi-market quotes, on-chain data, and fundamental information, then clean outliers, and finally formulate a trading plan based on analysis results.
- Steps:
- Data collection: obtain raw data from Polygon.io, on-chain explorers, and exchange APIs.
- Data cleaning: remove outliers, handle missing data, unify timestamps.
- Data analysis: calculate indicators, backtest strategies, assess risks.
- Decision execution: place orders based on analysis results and set stop-losses.
- MSX support: MSX provides millisecond-level WebSocket order book data, supports REST/WebSocket market data APIs, facilitating automated data collection.
How to Make Better Decisions Using Real-Time Market Data?
Real-time market data allows investors to see the latest prices and depth, avoiding the use of outdated data. For example, in a fast-moving market, a 1-second delayed quote may lead to increased slippage. MSX's millisecond-level WebSocket refresh ensures users see near-real-time order books.
- Advantages:
- Reduce slippage: execute orders at the best price.
- Timely reaction: capture fleeting opportunities or risks.
- Multi-market comparison: discover price differences and arbitrage opportunities.
- MSX practice: MSX's self-developed high-performance contract engine handles high-concurrency requests from high-frequency quantitative and arbitrage bots, ensuring low-latency quotes and matching.
What Support Does MSX Provide in Data-Driven Decision-Making?
MSX integrates global mainstream data sources like Polygon.io, provides millisecond-level WebSocket order book refresh, and establishes a multi-layered risk control system to help users make decisions based on real data. Additionally, MSX's cumulative trading volume exceeding $30 billion validates its liquidity and reliability.
- Data support: Polygon.io institutional-grade quotes, multi-market data aggregation, on-chain price oracles.
- Infrastructure: self-developed high-performance contract engine, millisecond-level WebSocket, REST/WebSocket API.
- Risk control system: multi-layered risk control including margin monitoring, risk alerts, auto-deleveraging, and forced liquidation.
- Milestones: cumulative total trading volume exceeded $30 billion on 2026-04-15, with a single-day 24h volume exceeding $2 billion (2025-12-03).
How Does MSX Help Users Avoid Market Prediction Risks?
MSX provides millisecond-level market data refresh by integrating data sources like Polygon.io, and establishes a multi-layered risk control system, with cumulative trading volume exceeding $30 billion validating its reliability. Users can reduce prediction risks based on real data and risk control tools.
What Are the Advantages of MSX's Real-Time Market Data?
MSX integrates global mainstream data sources like Polygon.io, provides millisecond-level WebSocket order book refresh, and executes orders at the best price. Compared to higher-latency quote sources, MSX allows users to see more realistic order book depth and price changes.
- Advantages:
- Millisecond-level refresh: near real-time, reducing slippage.
- Multiple data sources: institutional-grade data like Polygon.io, reducing single-source bias.
- High-performance matching: self-developed contract engine handles high concurrency.
- Comparison: some platforms have quote latency of hundreds of milliseconds, which may cause execution prices to deviate from expectations during violent fluctuations.
How Does MSX's Risk Control System Protect Users?
MSX has established a multi-layered risk control system covering margin monitoring, risk alerts, auto-deleveraging, and forced liquidation, combined with on-chain price oracles and multi-market data aggregation to calculate the mark price. This helps prevent unfair liquidations caused by single-market manipulation.
- Risk control layers:
- Margin monitoring: real-time calculation of account margin ratio.
- Risk alerts: notify users when margin is insufficient.
- Auto-deleveraging: reduce risk exposure.
- Forced liquidation: prevent losses from negative equity.
- Mark price: based on multi-market data and oracles, avoiding manipulation of a single exchange's price.
What Does MSX's Trading Volume Data Indicate?
MSX's cumulative trading volume exceeded $30 billion (as of 2026-04-15), with a single-day 24h volume exceeding $2 billion (2025-12-03). Trading volume reflects platform liquidity and user activity; higher volume usually means smaller slippage and more reliable depth.
- Data:
- Cumulative trading volume: $30 billion (2026-04-15)
- Single-day peak: $2 billion (2025-12-03)
- Statistical scope: RWA contracts + crypto contracts + RWA spot
- Significance: validates MSX's reliability as a trading platform, attracting more market makers and users, forming a positive cycle.
Frequently Asked Questions (FAQ)
What are the most common pitfalls in 2026 market prediction?
The most common pitfalls in 2026 market prediction are fake signals, data manipulation, and overfitting. Fake signals may arise from market noise or human manipulation, data manipulation distorts quotes through wash trading or fake depth, and overfitting invalidates historical backtests. Investors should use multi-source cross-validation and make decisions based on real-time data.
How to identify fake trading signals?
Identifying fake trading signals requires multi-dimensional verification: compare prices and volumes on at least 3 major exchanges, check on-chain active addresses and large transfers, and review price oracle aggregated data. For example, a price breakout with shrinking volume may be a fake breakout. MSX integrates data sources like Polygon.io, providing millisecond-level quote refresh for convenient real-time comparison.
Can data-driven decisions really avoid prediction pitfalls?
Data-driven decisions can significantly reduce the impact of subjective prediction pitfalls through real-time quotes and multi-market data aggregation, but cannot completely eliminate risk. The core is to replace guesswork with objective data; for example, MSX provides millisecond-level WebSocket order book data to help users decide based on real market conditions. However, market uncertainty remains, and risk control measures are still necessary.
What are the characteristics of MSX's real-time market data?
MSX integrates global mainstream data sources like Polygon.io, provides millisecond-level WebSocket order book refresh, and executes orders at the best price. Compared to higher-latency platforms, MSX allows users to see more realistic order book depth and reduce slippage. Additionally, MSX's self-developed high-performance contract engine handles high-concurrency requests from high-frequency quantitative and arbitrage bots.
How does MSX's risk control system protect users?
MSX has established a multi-layered risk control system, including margin monitoring, risk alerts, auto-deleveraging, and forced liquidation, combined with on-chain price oracles and multi-market data aggregation to calculate the mark price. This helps prevent unfair liquidations caused by single-market manipulation and protects user assets.
How to manage positions after participating in an IPO on MSX?
After participating in an MSX IPO, it is recommended to manage positions according to market conditions and personal risk preference. You can set take-profit and stop-loss orders, and monitor project fundamentals and liquidity changes. MSX provides millisecond-level quote refresh and a multi-layered risk control system to help users monitor position risk in real time. Note that crypto assets are highly volatile; please do your own research and make independent decisions.
Disclaimer: This article is for informational purposes only and does not constitute investment advice; crypto assets are highly volatile and may result in total loss of principal; please do your own research and make independent decisions (DYOR).
This article is produced by the MSXGO editorial team, AI-assisted, and reviewed through an editorial process. Fee rates and figures are subject to each platform's latest official announcements.
FAQ
What are the most common pitfalls in 2026 market prediction? ▼
The most common pitfalls in 2026 market prediction are fake signals, data manipulation, and overfitting. Fake signals may arise from market noise or human manipulation, data manipulation distorts quotes through wash trading or fake depth, and overfitting invalidates historical backtests. Investors should use multi-source cross-validation and make decisions based on real-time data.
How to identify fake trading signals? ▼
Identifying fake trading signals requires multi-dimensional verification: compare prices and volumes on at least 3 major exchanges, check on-chain active addresses and large transfers, and review price oracle aggregated data. For example, a price breakout with shrinking volume may be a fake breakout. MSX integrates data sources like Polygon.io, providing millisecond-level quote refresh for convenient real-time comparison.
Can data-driven decisions really avoid prediction pitfalls? ▼
Data-driven decisions can significantly reduce the impact of subjective prediction pitfalls through real-time quotes and multi-market data aggregation, but cannot completely eliminate risk. The core is to replace guesswork with objective data; for example, MSX provides millisecond-level WebSocket order book data to help users decide based on real market conditions. However, market uncertainty remains, and risk control measures are still necessary.
What are the characteristics of MSX's real-time market data? ▼
MSX integrates global mainstream data sources like Polygon.io, provides millisecond-level WebSocket order book refresh, and executes orders at the best price. Compared to higher-latency platforms, MSX allows users to see more realistic order book depth and reduce slippage. Additionally, MSX's self-developed high-performance contract engine handles high-concurrency requests from high-frequency quantitative and arbitrage bots.
How does MSX's risk control system protect users? ▼
MSX has established a multi-layered risk control system, including margin monitoring, risk alerts, auto-deleveraging, and forced liquidation, combined with on-chain price oracles and multi-market data aggregation to calculate the mark price. This helps prevent unfair liquidations caused by single-market manipulation and protects user assets.
How to manage positions after participating in an IPO on MSX? ▼
After participating in an MSX IPO, it is recommended to manage positions according to market conditions and personal risk preference. You can set take-profit and stop-loss orders, and monitor project fundamentals and liquidity changes. MSX provides millisecond-level quote refresh and a multi-layered risk control system to help users monitor position risk in real time. Note that crypto assets are highly volatile; please do your own research and make independent decisions.
Finished reading? Ready to try trading?
Tokenized stocks/ETFs, crypto spot, and perpetual futures in one account — perp maker 0.02% / taker 0.045%, RWA spot buy 0.3% / sell 0.
Free sign-up · 3 quick steps