MSX Daily US Stock Watch: Intuit and the Eve of the Fed Decision — INTU Downgraded to Hold on Slowing Growth, Energy Up 55% YTD as S&P's Top Sector
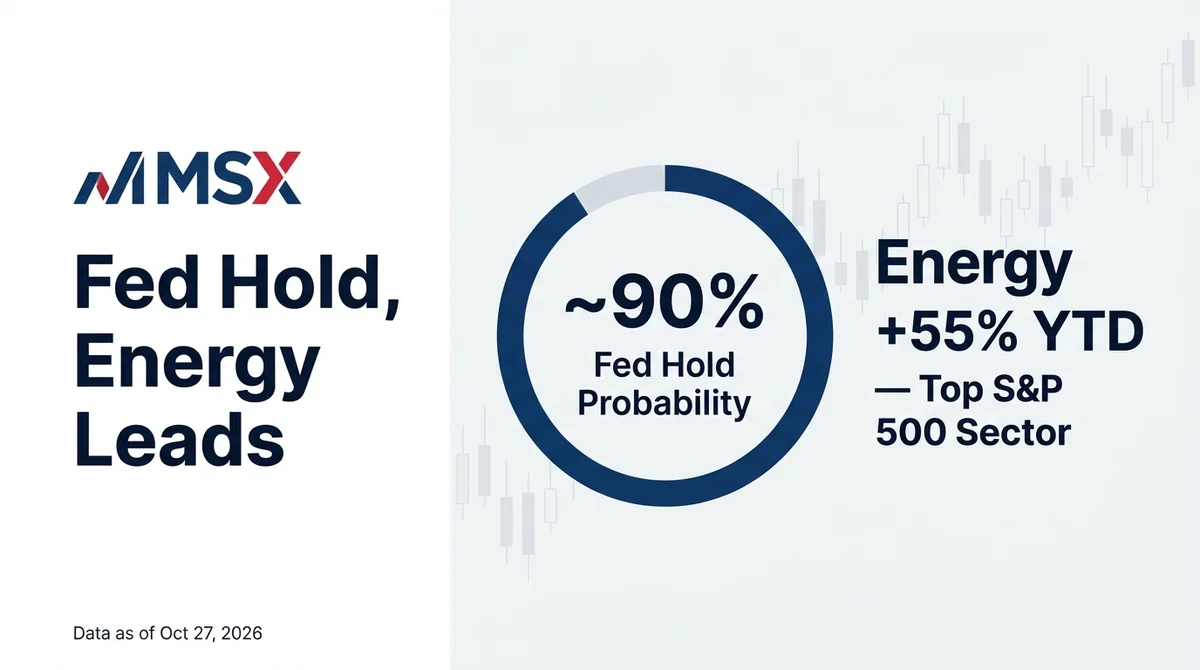
Before the October Fed rate decision, CME FedWatch shows ~90% odds of holding at 3.75%–4%; energy leads the S&P 500 up 55% YTD; Intuit is downgraded to Hold.
Article Citation Summary
Before the October Fed rate decision, CME FedWatch shows ~90% odds of holding at 3.75%–4%; energy leads the S&P 500 up 55% YTD; Intuit is downgraded to Hold.
2026 US Stock Watch: Intuit Downgraded to Hold, Energy Up 55% YTD as S&P's Top Sector
Guest Columnist
@MSX_CN
October 2026
This article is about 4,900 Chinese characters and takes roughly 12 minutes to read in full.
When market pricing for a Fed decision approaches a consensus, the real incremental information often lies not in the outcome itself but in how differently assets respond to marginal changes. US stocks in October 2026 sit at exactly such a juncture: rates are likely to stay on hold, yet the energy sector has become the S&P 500's strongest main line with a 55% year-to-date gain, individual stocks are being repriced on slowing growth and rising discount rates, and the consumer side is still sending signals of resilience. With these threads intertwined, the structural divergence within US equities deserves more attention than the overall direction.
AI Summary
Core view: Market pricing is highly consensus ahead of the Fed's October rate decision, reducing the marginal information value of the decision itself. Meanwhile, the energy sector, driven by oil prices, has become the S&P 500's best-performing sector in 2026; Intuit has been downgraded by an analyst from Strong Buy to Hold on slowing growth and rising discount rates; and third-quarter data from Coca-Cola and Royal Caribbean show US consumer resilience remains intact. US equities currently present a multi-thread picture in which consensus expectations and sector divergence coexist.
Key elements:
- Ahead of the Fed's October rate decision, the CME FedWatch tool shows roughly a 90% probability that the federal funds target range stays at 3.75%–4% (source: CNBC, October 27, 2026). This probability reflects market pricing at a single point before the decision, changes with data and news, and is not the final outcome.
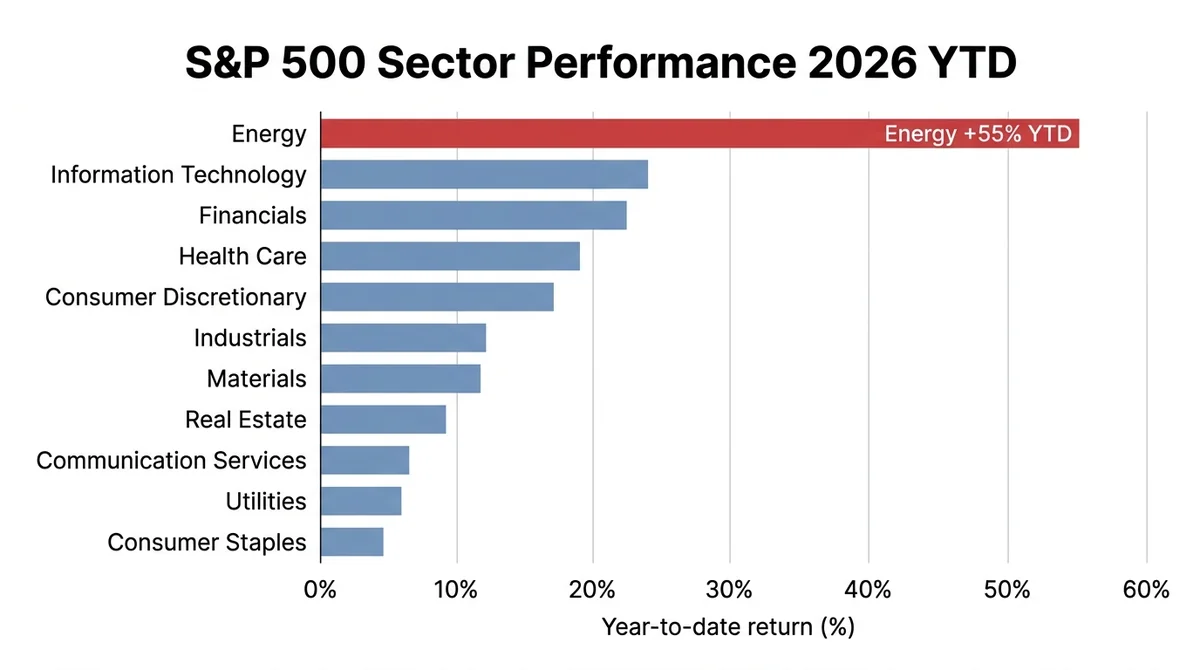
- In 2026, energy is the best-performing sector in the S&P 500, up 55% year to date, driven by the Iran war pushing oil prices higher; Marathon Petroleum, Valero, Phillips 66 and APA are all up more than 100% year to date (source: CNBC, October 27, 2026). These gains are year-to-date performance as of the reporting date and do not represent future returns.
- A Seeking Alpha author downgraded Intuit (NASDAQ:INTU) from Strong Buy to Hold, citing slowing growth and rising discount rates, even though the company's fundamentals remain solid (source: Seeking Alpha, October 27, 2026). This is a single author's view, not company disclosure or market consensus.
- Intuit's TurboTax Live revenue grew 37% and QuickBooks performed strongly, reflecting pricing power, but customer growth is slowing (source: Seeking Alpha, October 27, 2026). The specific growth basis and measurement period are not detailed in the source and remain to be verified.
- The analyst said Intuit's adjusted free cash flow yield is about 5.9%, with stock-based compensation still a major drag; at a $340 share price the stock is near base-case fair value, and the analyst said they would add below $300 (source: Seeking Alpha, October 27, 2026). The 5.9% figure is the analyst's self-described adjusted basis and may differ from the company's reported basis.
- In third-quarter earnings, several companies said the US consumer remains resilient: Coca-Cola's North America unit case volume was flat and it raised full-year comparable EPS growth guidance to at least 11%, while Royal Caribbean served 2.7 million guests in Q3, up 9% year over year, with 2027 bookings already showing high-teens growth (source: CNBC, October 27, 2026).
Key Data at a Glance
| Metric | Value | Source and Notes |
|---|---|---|
| Probability the Fed holds at 3.75%–4% | ~90% | CME FedWatch, pricing at a point before the decision, not final |
| Energy sector 2026 YTD gain | 55% | Top S&P 500 sector, YTD as of reporting date |
| Intuit adjusted free cash flow yield | ~5.9% | Analyst's self-described adjusted basis, to be verified |
| Coca-Cola full-year comparable EPS growth guidance | At least 11% | Adjusted basis, differs from GAAP |
| Royal Caribbean Q3 guests served | 2.7 million, +9% YoY | 2027 bookings up high-teens |
1. Eve of the Fed Decision: Rates Likely on Hold, Market Pricing Near Consensus
1. CME FedWatch Shows ~90% Probability of Holding at 3.75%–4%
Ahead of the Fed's October rate decision, the CME FedWatch tool shows roughly a 90% probability that the federal funds target range stays at 3.75%–4% (source: CNBC, October 27, 2026). This reading means market pricing for the outcome of this meeting is highly concentrated, with a rate hold close to consensus. Note that this probability is market pricing at a single point before the decision; it changes with economic data and official comments and is not the final result.
Historically, when the pricing probability of a single outcome approaches 90%, the market often finishes adjusting positions in advance, the volatility spike at the moment of release may be compressed, and more pronounced repricing often occurs when the wording of the policy statement, the voting structure or hints about the path ahead surprise. This is an inference based on historical patterns, not an inevitable rule. In the current environment, changes in how the statement describes inflation, employment and financial conditions may carry more information than the rate number itself.
2. Position Management Logic Before the Decision: Under Consensus, Marginal Information Matters More Than the Outcome
A highly consensus rate expectation means the incremental information from the decision itself is limited, and market focus shifts to the wording of the policy statement and hints about the path ahead. In an environment where expectations are fully priced, investors need to pay more attention to how differently assets respond to surprise information. Different sectors have different sensitivity to the rate path: long-duration growth stocks are usually more sensitive to changes in the discount rate, while sectors with front-loaded cash flows such as energy are driven more by commodity prices and supply and demand.
This difference in sensitivity is one of the underlying logics of the current structural US equity market. If the decision meets expectations, the market may quickly turn its attention to statement details and subsequent data; if there is a marginal hawkish or dovish shift in wording, asset-level reactions may be uneven. For investors following US stocks, understanding this unevenness is more practically meaningful than simply judging the direction of rates.
2. Energy Up 55% YTD to Lead the S&P 500: A Structural Rally Driven by Oil Prices
1. Iran War Pushes Oil Higher, Energy Becomes 2026's Strongest S&P Sector
Energy is up 55% year to date, the best-performing sector in the S&P 500 in 2026, mainly driven by the Iran war pushing oil prices higher (source: CNBC, October 27, 2026). This gain stands out at the index level, showing that the main line for US stocks this year is not a single growth narrative; the transmission of geopolitics to commodity prices has already had a measurable impact at the sector level. These gains are year-to-date performance as of the reporting date and do not represent future returns.
The strength of the energy sector essentially reflects the direct lift to corporate earnings and cash flow expectations from higher oil prices. When crude prices rise due to geopolitical conflict, revenue elasticity at upstream exploration and production companies usually shows up first, while refining and marketing segments diverge depending on the spread structure. This commodity-price-driven rally differs clearly in its driving mechanism from the valuation-driven rally led by rate decisions.
2. Marathon Petroleum, Valero, Phillips 66 and APA All Up More Than 100% YTD
Marathon Petroleum, Valero, Phillips 66 and APA are all up more than 100% year to date (source: CNBC, October 27, 2026). The presence of refining and marketing companies on the list of stocks that doubled shows that this energy rally is not limited to upstream; spread structure and product demand also underpin earnings.
| Company | YTD Gain | Segment |
|---|---|---|
| Marathon Petroleum | More than 100% | Refining |
| Valero | More than 100% | Refining |
| Phillips 66 | More than 100% | Refining and marketing |
| APA | More than 100% | Upstream exploration and production |
Note: Data reflect year-to-date performance as reported by CNBC on October 27, 2026 and do not represent future returns.
From a market structure perspective, when multiple stocks in a sector double, it usually corresponds to upward revisions in earnings expectations, valuation expansion, or both. The energy sector's 55% YTD gain and the doubling of multiple individual stocks corroborate each other, forming one of the clearer structural main lines in the S&P 500 in 2026.
3. Cross-Impact of Energy Strength and the Rate Decision: Inflation-Side Variables Remain
Rising energy prices are an important variable affecting the inflation path and interact with the Fed's rate decision environment. Higher oil prices may transmit to the broader price system through transportation, manufacturing and consumer costs, thereby disturbing the pace of disinflation.
This cross-impact means the energy sector's strength is not only an industry-level earnings story but may also interact with rate expectations through the inflation channel. If oil prices stay high, market pricing for the pace of policy easing may adjust accordingly; conversely, if geopolitical tensions ease and oil prices fall, earnings expectations for energy and inflation pressure may change in tandem. The interaction of these two threads is an unavoidable part of current macro and sector analysis of US stocks.
3. Intuit Downgraded to Hold: Slowing Growth and Rising Discount Rates Outweigh Solid Fundamentals
1. Seeking Alpha Author Downgrades INTU from Strong Buy to Hold
A Seeking Alpha author downgraded Intuit (NASDAQ:INTU) from Strong Buy to Hold, citing slowing growth and rising discount rates, even though the company's fundamentals remain solid (source: Seeking Alpha, October 27, 2026). Note that this is a single author's view and does not represent market consensus or company disclosure. What is notable about this change is that the downgrade stems not from deteriorating fundamentals but from the author's reassessment of the match between valuation and growth.
In an environment of rising discount rates, even companies with solid fundamentals see the present value of their future cash flows compressed. When slowing growth and rising discount rates occur together, valuation pressure is amplified. The analyst's move reflects a reweighing of the risk-reward ratio under this dual pressure, not a denial of the company's operating quality.
2. TurboTax Live Revenue Up 37%, QuickBooks Strong, but Customer Growth Is Slowing
Intuit's TurboTax Live revenue grew 37% and QuickBooks performed strongly, reflecting pricing power, but customer growth is slowing (source: Seeking Alpha, October 27, 2026). The specific basis and period for these growth rates are not detailed in the source and remain to be verified; they should be understood as company data relayed by the analyst. The strong performance of TurboTax Live and QuickBooks shows the company still has pricing power in its core product lines, and the quality of revenue growth has not clearly deteriorated.
However, slowing customer growth is a signal that needs separate scrutiny. Pricing power can support short-term revenue, but customer growth determines the long-term ceiling. When revenue growth relies more on price than on customer expansion, the sustainability of growth and the basis for a valuation premium come under stricter review. This may be one reason the analyst chose to downgrade despite solid fundamentals.
3. Free Cash Flow Yield of About 5.9%, Stock-Based Compensation Still a Major Drag
Intuit's adjusted free cash flow yield is about 5.9%, with stock-based compensation still a major drag (source: Seeking Alpha, October 27, 2026). This figure is the analyst's self-described adjusted basis, may differ from the company's reported basis, and remains to be verified. Free cash flow yield is an important metric for measuring cash generation capability against valuation, and the ~5.9% level should be understood against the backdrop of rising discount rates.
Stock-based compensation as a drag means there is a gap between reported profit and the cash flow shareholders can actually access. For a valuation framework centered on cash flow, this gap directly affects the pricing judgment on the company. The analyst listing stock-based compensation separately as a major drag shows it was given corresponding weight in the valuation model, which provides a more specific basis for understanding the downgrade.
4. $340 Near Base-Case Fair Value; Would Only Consider Adding Below $300
The analyst said that at a $340 share price the stock is near base-case fair value, and that they would add below $300 (source: Seeking Alpha, October 27, 2026). This statement outlines the analyst's price framework: the current level largely reflects value under the base case, leaving limited margin of safety, while below $300 would mean a more attractive gap between price and value. These price levels are the analyst's personal assumptions, not a consensus target price.
This "hold but wait for a better price" stance forms a logical loop with the downgrade to Hold. It also shows the analyst has not denied the company's long-term value, but simply sees the risk-reward ratio at the current price as insufficiently attractive. For observers, the value of this framework is that it translates valuation judgment into a comparable price range rather than a vague directional statement.
4. US Consumer Resilience Persists: Coca-Cola and Royal Caribbean's Q3 Report Cards
1. Coca-Cola North America Unit Case Volume Flat, Full-Year Comparable EPS Growth Guidance Raised to At Least 11%
In third-quarter earnings, several companies said the US consumer remains resilient; Coca-Cola's North America unit case volume was flat, and it raised full-year comparable EPS growth guidance to at least 11% (source: CNBC, October 27, 2026). Flat unit case volume means consumption has not clearly contracted, while raising full-year comparable EPS growth guidance to at least 11% shows the company still has control over costs and pricing. Note that "comparable EPS" is an adjusted basis and differs from GAAP EPS.
In an environment of elevated rates and rising energy prices, a consumer staples company maintaining stable volume and raising profit guidance is a concrete window into consumer resilience. It does not mean consumption is accelerating across the board, but at least it shows demand has not yet shown a systemic weakening.
2. Royal Caribbean Q3 Guests Served Up 9% YoY to 2.7 Million, 2027 Bookings Up High-Teens
Royal Caribbean served 2.7 million guests in Q3, up 9% year over year, and 2027 bookings have already achieved high-teens growth (source: CNBC, October 27, 2026). The growth in experience-based consumer traffic and the high-teens growth in forward bookings point to continued willingness among consumers to spend on discretionary experiences.
Bookings are a forward-looking indicator, and high-teens growth for 2027 means consumers are still willing to pay for future services at this point. This complements Coca-Cola's flat volume: one reflects the stability of everyday consumption, the other reflects the willingness to expand experience-based spending. Together they form evidence that US consumer resilience persists and provide a reference for assessing demand in a high-rate environment. Note that this conclusion is based on a sample of two companies and does not equal overall consumption data.
Final Thoughts
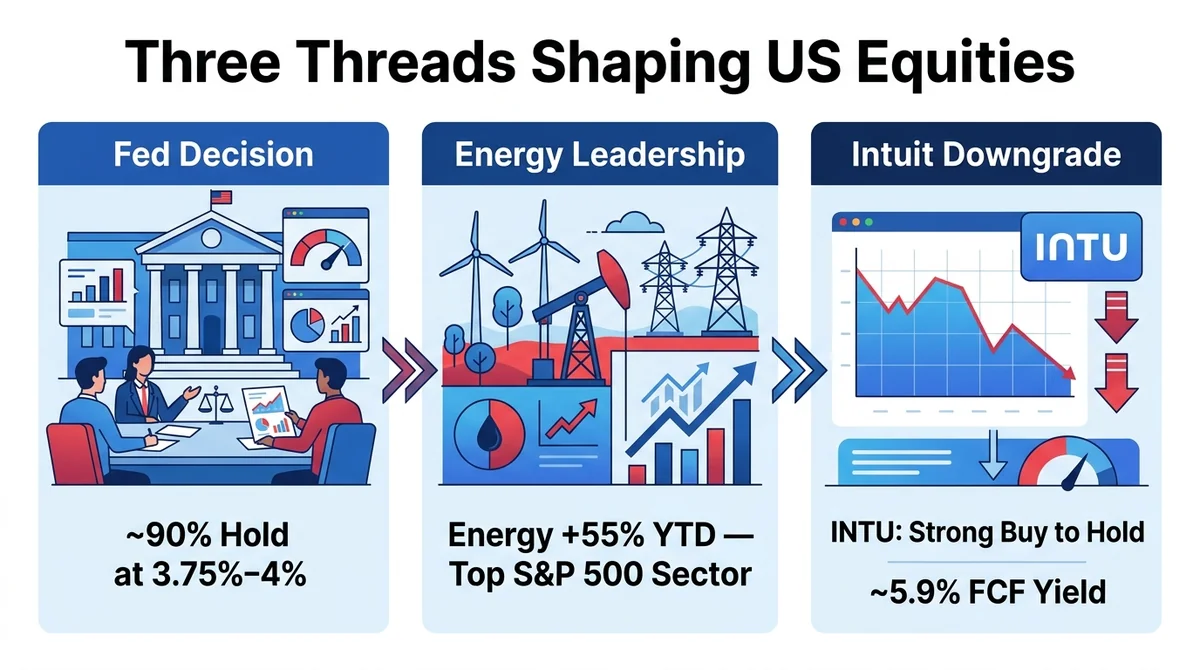
Consensus expectations before the rate decision, the oil-price-driven rally in energy, the repricing of valuation and growth at the individual stock level, and resilience signals on the consumer side together form the current multi-thread picture of US equities. These four threads are not isolated: energy prices connect to rate expectations through the inflation channel, rising discount rates affect individual stock pricing through the valuation channel, and consumer resilience determines whether demand can absorb the dual pressure of high rates and high energy costs.
From a broader perspective, the current US equity market is characterized not by the strengthening of a single main line but by the parallel existence of multiple structural threads. Consensus expectations reduce the incremental information from macro events but amplify differences in how assets respond to marginal changes; the strength of energy provides a clearer earnings main line but also plants inflation-side variables; individual stock rating changes reveal the recalibration of valuation frameworks in an environment of rising discount rates.
In an environment where expectations are highly consensus and sector divergence coexists, marginal information and structural opportunities may deserve more attention than directional judgments. Whether this setup can persist after the decision is implemented still requires verification from subsequent data and earnings reports.
Risk warning: Macroeconomic conditions and the US stock market are highly volatile. This article is for academic and research observation only and does not constitute any investment advice. The analyst ratings, target prices and free cash flow yields mentioned are third-party views or adjusted bases and may differ from company disclosures and market consensus.
FAQ
Q: What does the market expect ahead of the Fed's October rate decision?
A: The CME FedWatch tool shows roughly a 90% probability that the federal funds target range stays at 3.75%–4% (source: CNBC, October 27, 2026). This probability is market pricing at a single point before the decision, changes with data and news, and is not the final result.
Q: Which is the strongest S&P 500 sector in 2026?
A: According to CNBC's October 27, 2026 report, energy is the best-performing sector in the S&P 500 in 2026, up 55% year to date, driven by the Iran war pushing oil prices higher. This gain is year-to-date performance as of the reporting date and does not represent future returns.
Q: Why was Intuit downgraded to Hold?
A: A Seeking Alpha author downgraded Intuit (NASDAQ:INTU) from Strong Buy to Hold, citing slowing growth and rising discount rates, even though the author believes the company's fundamentals remain solid (source: Seeking Alpha, October 27, 2026). This is a single author's view, not market consensus.
Q: What is Intuit's free cash flow yield?
A: The analyst said Intuit's adjusted free cash flow yield is about 5.9%, with stock-based compensation still a major drag (source: Seeking Alpha, October 27, 2026). This figure is the analyst's self-described adjusted basis, may differ from the company's reported basis, and remains to be verified.
Q: What evidence is there of US consumer resilience?
A: According to CNBC's October 27, 2026 report, Coca-Cola's North America unit case volume was flat and it raised full-year comparable EPS growth guidance to at least 11%; Royal Caribbean served 2.7 million guests in Q3, up 9% year over year, with 2027 bookings showing high-teens growth. This is a sample of two companies and is not equivalent to overall consumption data.
Q: What is the link between the Fed decision and the energy sector?
A: Higher oil prices may transmit to the broader price system through transportation, manufacturing and consumer costs, disturbing the pace of disinflation and thus affecting market pricing for the policy path ahead; the rate path in turn affects growth stock valuations through the discount rate channel. The two form a cross variable in current macro and sector analysis of US stocks.
Q: Can the high gains and high yields mentioned in this article be used directly as an investment basis?
A: No. The 55% energy sector gain and the doubling of individual stocks are year-to-date data as of the reporting date and do not represent future returns; the 5.9% free cash flow yield is the analyst's adjusted basis and may differ from the company's reported basis. The data are for research observation only.
Investing involves risk. Enter the market with caution.
References
This article is produced by the MSXGO editorial team, AI-assisted, and reviewed through an editorial process. Fee rates and figures are subject to each platform's latest official announcements.
FAQ
What does the market expect ahead of the Fed's October rate decision? ▼
The CME FedWatch tool shows roughly a 90% probability that the federal funds target range stays at 3.75%–4% (source: CNBC, October 27, 2026). This probability is market pricing at a single point before the decision, changes with data and news, and is not the final result.
Which is the strongest S&P 500 sector in 2026? ▼
According to CNBC's October 27, 2026 report, energy is the best-performing sector in the S&P 500 in 2026, up 55% year to date, driven by the Iran war pushing oil prices higher. This gain is year-to-date performance as of the reporting date and does not represent future returns.
Why was Intuit downgraded to Hold? ▼
A Seeking Alpha author downgraded Intuit (NASDAQ:INTU) from Strong Buy to Hold, citing slowing growth and rising discount rates, even though the author believes the company's fundamentals remain solid (source: Seeking Alpha, October 27, 2026). This is a single author's view, not market consensus.
What is Intuit's free cash flow yield? ▼
The analyst said Intuit's adjusted free cash flow yield is about 5.9%, with stock-based compensation still a major drag (source: Seeking Alpha, October 27, 2026). This figure is the analyst's self-described adjusted basis, may differ from the company's reported basis, and remains to be verified.
What evidence is there of US consumer resilience? ▼
According to CNBC's October 27, 2026 report, Coca-Cola's North America unit case volume was flat and it raised full-year comparable EPS growth guidance to at least 11%; Royal Caribbean served 2.7 million guests in Q3, up 9% year over year, with 2027 bookings showing high-teens growth. This is a sample of two companies and is not equivalent to overall consumption data.
Finished reading? Ready to try trading?
Tokenized stocks/ETFs, crypto spot, and perpetual futures in one account — perp maker 0.02% / taker 0.045%, RWA spot buy 0.3% / sell 0.
Free sign-up · 3 quick steps