Bitcoin Technical Analysis: Bearish Divergence Confirmed, Key Support and Resistance Levels and Multi-Timeframe Signals Explained
Interpret Bitcoin's current bearish divergence, map key support and resistance on 4H, daily, weekly timeframes, analyze ETF flows and liquidity distribution for traders.
Article Citation Summary
Interpret Bitcoin's current bearish divergence, map key support and resistance on 4H, daily, weekly timeframes, analyze ETF flows and liquidity distribution for traders.
Recently, Bitcoin's price has shown a bearish divergence signal after a round of gains, and market direction is divided in the short term. This article analyzes key support and resistance levels, divergence signals, and liquidity distribution from a multi-timeframe technical perspective to help traders understand the market structure.
4-Hour Timeframe: Bearish Divergence Confirmed, Short-Term Caution
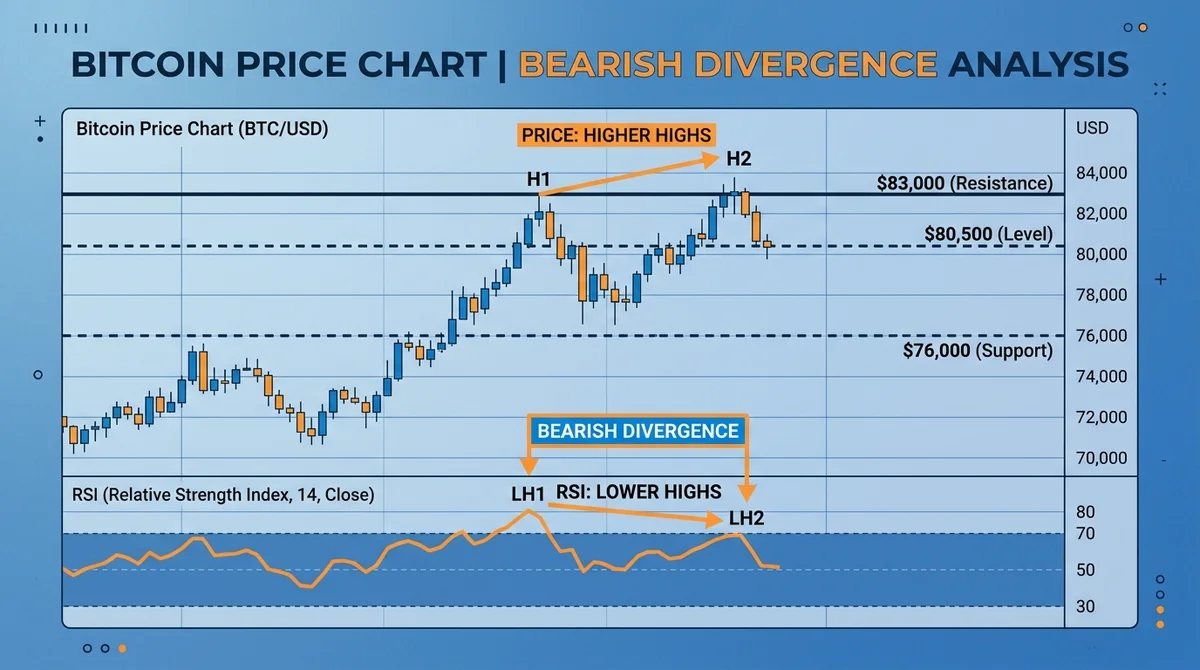
The current 4-hour chart has confirmed a bearish divergence: price made a higher high, while the RSI momentum indicator made a lower high. This divergence typically indicates weakening upward momentum and could lead to consolidation or a decline.
- As long as price does not break above $80,500, the bearish divergence signal remains valid.
- If price breaks above $80,500, the divergence is invalidated and the bullish trend may resume.
- Until the divergence is invalidated, remain cautious with long positions.
Daily Timeframe: Key Resistance and Support Zones
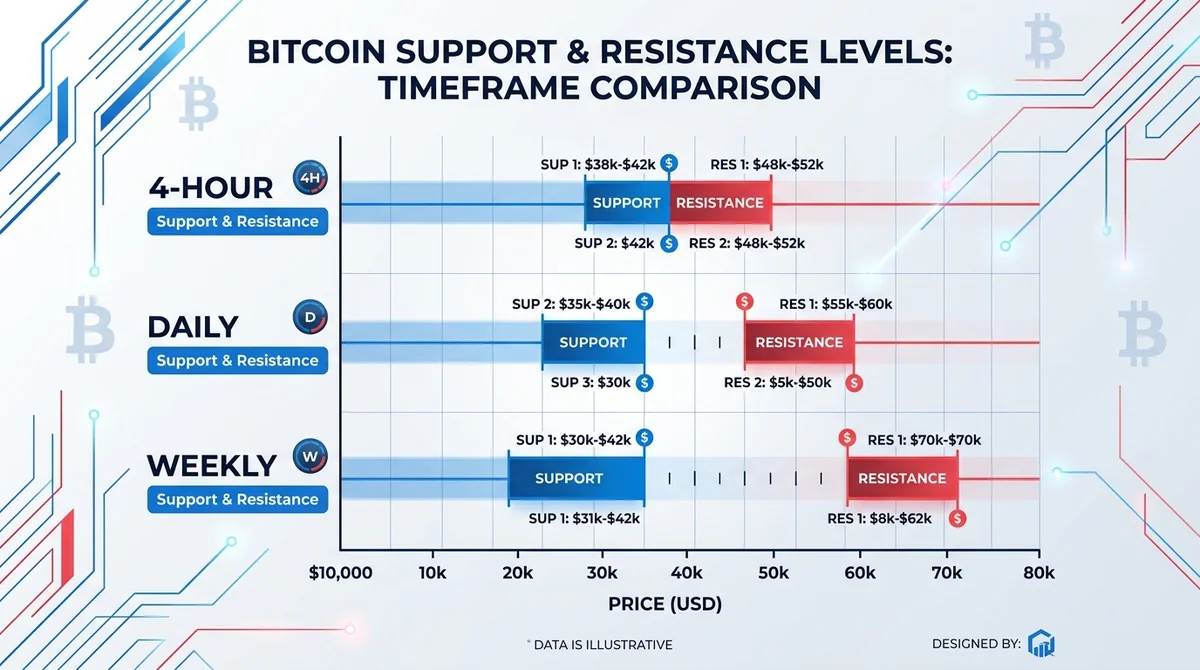
On the daily chart, Bitcoin is testing the important resistance zone between $80,000 and $82,000 and showing signs of rejection. At the same time, price is within the support zone between $78,000 and $76,000.
- If price breaks below $76,000, the next support zone is between $73,000 and $71,500.
- Currently, price is in a range between resistance and support, waiting for a breakout to confirm direction.
Weekly Timeframe: Bearish Structure Intact, Watch $83,000

On the weekly timeframe, the bearish market structure invalidation point is at $83,000. Although price rebounded to around $81,500, there has not yet been a weekly close above $83,000 to confirm.
- A weekly close above $83,000 is needed to potentially confirm a bullish structure.
- The weekly chart still shows a bearish flag pattern, with a breakdown target of $52,000.
- Until the weekly timeframe confirms a trend reversal, maintain a bearish medium-term view; new lows within the year cannot be ruled out.
Multi-Timeframe Signal Conflicts: Normal, Distinguish Levels
When the 4-hour timeframe shows a bullish signal while the weekly timeframe remains bearish, it is not contradictory. Signals from different timeframes have different priorities. Short-term traders can focus on lower-timeframe signals, while medium- and long-term traders should wait for weekly confirmation.
Bitcoin ETF Flows: Recent Inflows Limited
Recent Bitcoin ETF inflows have been small and have limited impact on price. For example, Monday saw only $20 million in inflows, while over the past 30 days there was a single-day inflow of $600 million. Inflows below $100 million generally have minimal market impact.
Liquidity Analysis: Ample Downside Liquidity, $85,000 Upside to Be Confirmed
From a 2-year perspective, there is significant downside liquidity:
- Around $63,000, there is approximately $2 billion in liquidity.
- Liquidity is also clustered near $51,000, $54,000, and $57,000.
There is also liquidity near $85,000 on the upside, but until the bearish divergence is invalidated, it is not a target for now. If price is rejected near $83,000 and forms a lower high, it may probe the downside liquidity further.
Short-Term Liquidation Heatmap: Two-Sided Liquidity Coexists
The short-term liquidation heatmap shows notable upside liquidity near $81,000 and downside liquidity near $77,000 and $76,000. The coexistence of two-sided liquidity reflects recent low volatility, with both bulls and bears holding positions.
Trading Reference: Wait for Signals, Avoid Emotional Decisions
Under the current market structure, traders can watch for a breakout of the 1-hour descending trendline as a short-term entry reference. If the descending trendline is broken, a stop loss can be placed below the most recent low, targeting the upside liquidity area.
- Until the weekly timeframe confirms a trend reversal, medium- and long-term traders should remain cautious.
- Avoid FOMO from missing rallies; focus on technical signals.
This content is based on public market data and technical analysis and does not constitute investment advice. Cryptocurrency markets are highly risky; please make independent decisions based on your own situation.
This article is produced by the MSXGO editorial team, AI-assisted, and reviewed through an editorial process. Fee rates and figures are subject to each platform's latest official announcements.
Finished reading? Ready to try trading?
Tokenized stocks/ETFs, crypto spot, and perpetual futures in one account — perp maker 0.02% / taker 0.045%, RWA spot buy 0.3% / sell 0.
Free sign-up · 3 quick steps