Bitcoin Market Structure and Key Price Levels: 4-Hour, Daily, and Weekly Perspectives
Analyze Bitcoin's current market structure across 4-hour, daily, and weekly timeframes, key resistance and support levels, and the impact of ETF inflows on price.
Article Citation Summary
Analyze Bitcoin's current market structure across 4-hour, daily, and weekly timeframes, key resistance and support levels, and the impact of ETF inflows on price.
After a sharp rally, Bitcoin has entered a high-level consolidation phase, with growing divergence between bulls and bears. This article examines the current key price levels and market structure from the 4-hour, daily, and weekly timeframes to help readers understand the interplay between short-term fluctuations and long-term trends.
4-Hour Timeframe: High-Level Consolidation, Awaiting Directional Breakout
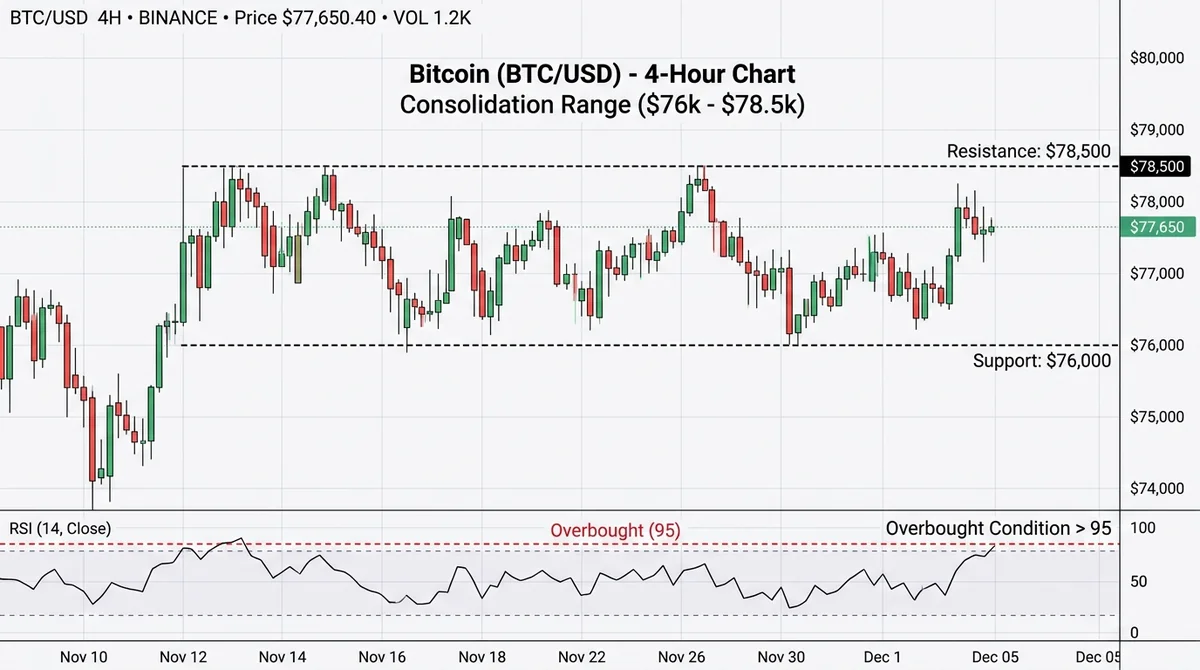
On the 4-hour chart, Bitcoin experienced a strong rally recently before cooling off over the weekend. The price is currently oscillating between $76,000 and $78,500, sitting in the middle of this range.
For traders, this area is a "no-trade zone" where blindly opening positions is not advisable. If the price fails to break above the previous high of $78,500 and instead forms a lower high and then breaks below the previous low of $76,000, a short opportunity may emerge, as the market would be forming lower highs and lower lows. Conversely, if the price breaks strongly above the previous high, the bullish structure continues and further upside is possible.
Notably, the 4-hour RSI previously reached an extremely overbought level of 95. Although it has pulled back somewhat, the risk of a short-term correction remains. If the price breaks above the previous high again, the RSI could re-enter overbought territory.
Daily Timeframe: Clear Resistance Zone, Avoid Counter-Trend Shorting
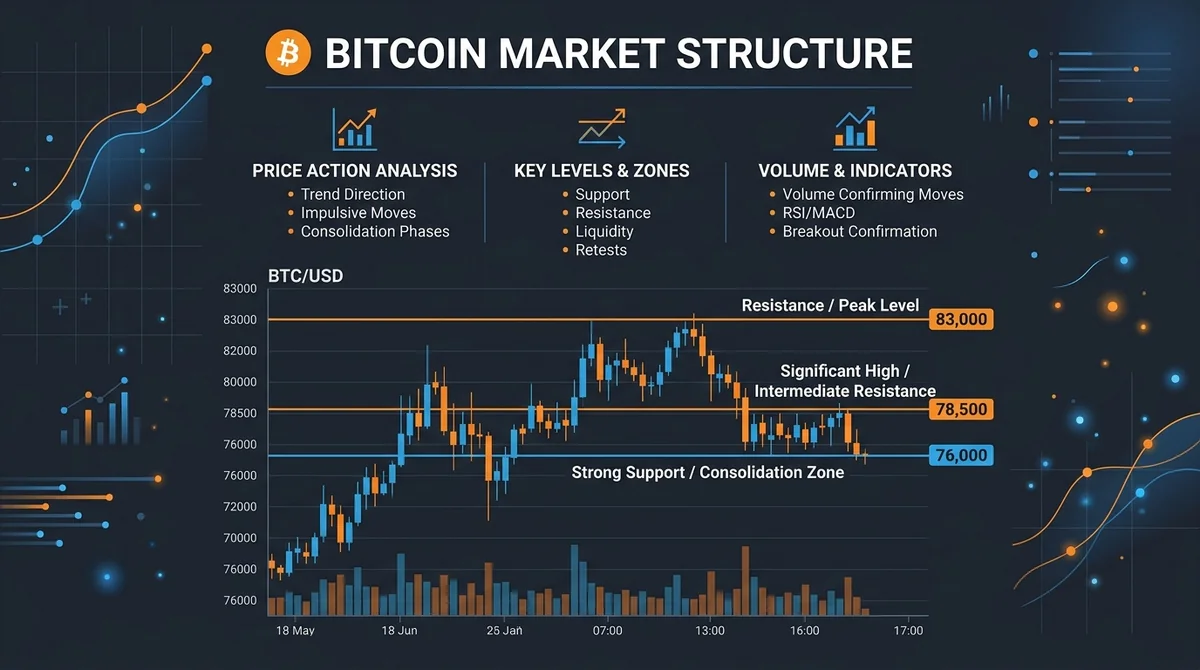
On the daily chart, Bitcoin broke above a descending trendline and completed an explosive rally following a Bollinger Band squeeze. The price is currently trading within a key resistance zone between $76,000 and $78,000. A daily close above $78,000 would open the next resistance zone at $80,000 to $82,000.
The daily RSI is also in overbought territory but has not reached extreme levels. Although a pullback is possible, shorting against such a steep uptrend is extremely risky. The market is currently showing extreme bullish momentum, which is mutually confirmed by the price action.
Weekly Timeframe: $83,000 as the Bull-Bear Watershed
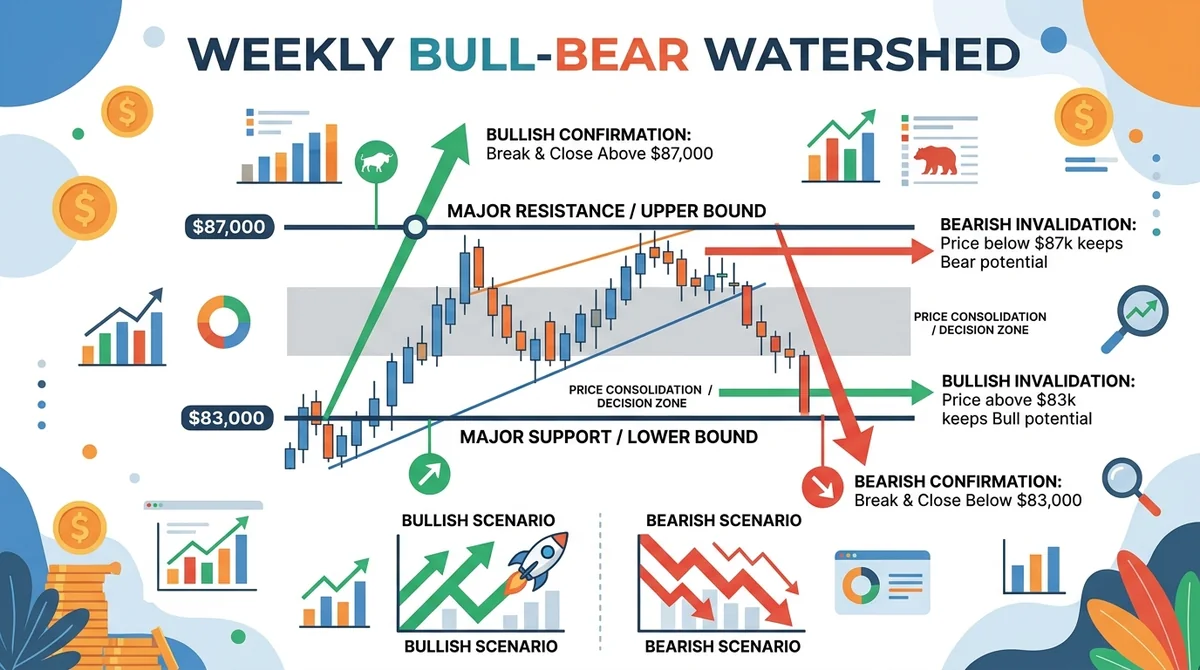
The weekly timeframe is crucial for judging the long-term trend. Since early 2026, after Bitcoin broke below a bearish flag near $87,000, the market has been targeting $52,000 as a downside objective. However, this bearish view has two invalidation conditions:
- $83,000: A weekly close above this level would mean the market is no longer forming lower highs but instead a higher high, thereby breaking the bearish structure.
- $87,000: A weekly close above this level would completely invalidate the bearish flag, and the $52,000 target would no longer apply.
Although the price has rebounded significantly, it has not yet broken above these key levels. Therefore, the long-term bearish outlook remains unchanged. Only when the market forms higher highs and higher lows on the weekly timeframe will the structure truly flip from bearish to bullish.
ETF Inflows: Short-Term Catalyst, but Not Enough to Change Structure
Bitcoin ETF inflows have been notable recently, with cumulative inflows of approximately $2 billion over the past week, including a single-day peak of over $600 million. These inflows provide support for Bitcoin's price, but ETF investors cannot trade on weekends, so the capital flows after this week's opening are worth watching.
Despite strong inflows, technical structure remains the core determinant of the trend. Until key levels are effectively broken, short-term rallies may be rebounds rather than reversals.
Liquidity Distribution: Significant Downside Liquidity Remains
From a 3-month timeframe liquidity analysis, there is substantial downside liquidity around $62,300 and $54,000. This means the market may first test these liquidity areas downward before continuing higher. At the same time, there is also upside liquidity near $84,700; if short-term momentum persists, the price could reach that area first.
The market is currently in an uptrend, but no clear reversal signal has emerged yet. Traders should remain cautious and closely monitor breakouts of key levels.
Summary: Key Levels Determine the Next Move
Across multiple timeframes, Bitcoin is currently at the intersection of short-term strength and long-term uncertainty. $83,000 and $87,000 are the core levels for gauging the long-term trend, while the resistance zone between $76,000 and $78,000 determines the short-term direction. Until key levels are effectively broken, downside risk remains. Investors should rationally assess short-term fluctuations and avoid emotional trading.
This article is produced by the MSXGO editorial team, AI-assisted, and reviewed through an editorial process. Fee rates and figures are subject to each platform's latest official announcements.
Finished reading? Ready to try trading?
Tokenized stocks/ETFs, crypto spot, and perpetual futures in one account — perp maker 0.02% / taker 0.045%, RWA spot buy 0.3% / sell 0.
Free sign-up · 3 quick steps