Bitcoin Short-Term Momentum Cools: Weekly Trend, Resistance Zones, and Key Technical Levels for Major Coins
Bitcoin stalled after touching $80K. Here's the weekly Super Trend flip watch, $80K-$82K resistance, 4H bearish divergence, and key levels for ETH, XRP, SOL, and LINK.
Article Citation Summary
Bitcoin stalled after touching $80K. Here's the weekly Super Trend flip watch, $80K-$82K resistance, 4H bearish divergence, and key levels for ETH, XRP, SOL, and LINK.
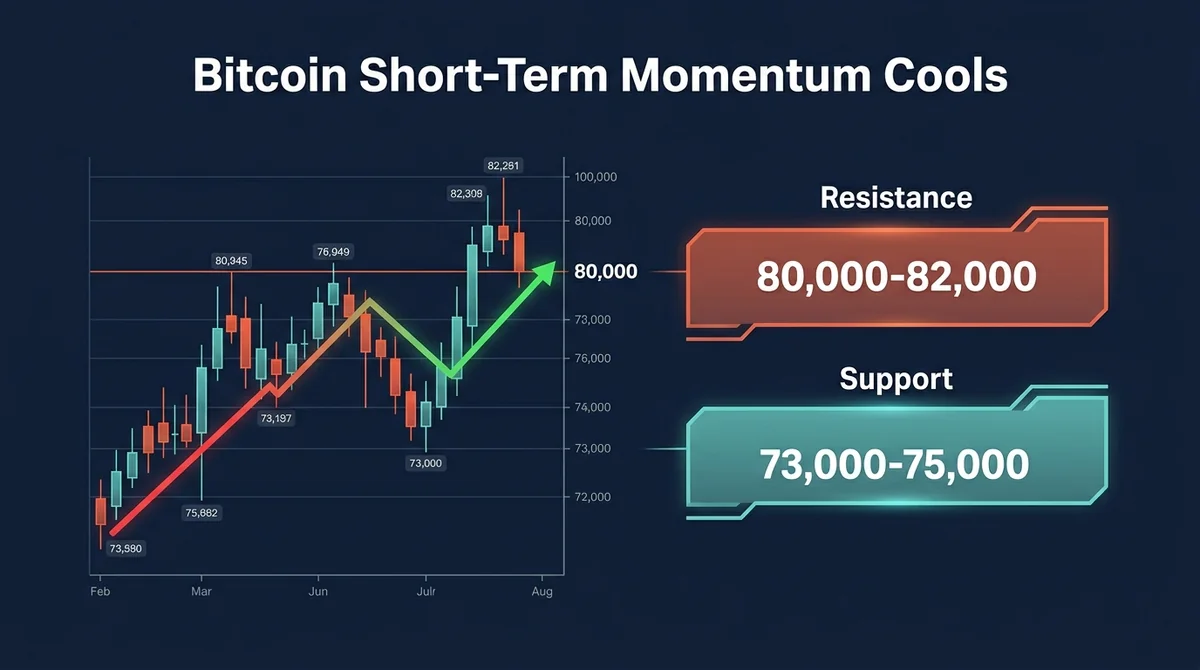
After its recent rapid rally, Bitcoin's short-term momentum is showing signs of cooling. Price briefly broke above $80,000 but has yet to secure a weekly close confirmation; meanwhile, a bearish divergence has formed on the 4-hour chart, and liquidity is gradually building below. Overall, the medium- to long-term structure remains bullish, but the short term calls for caution against a pullback or sideways consolidation.
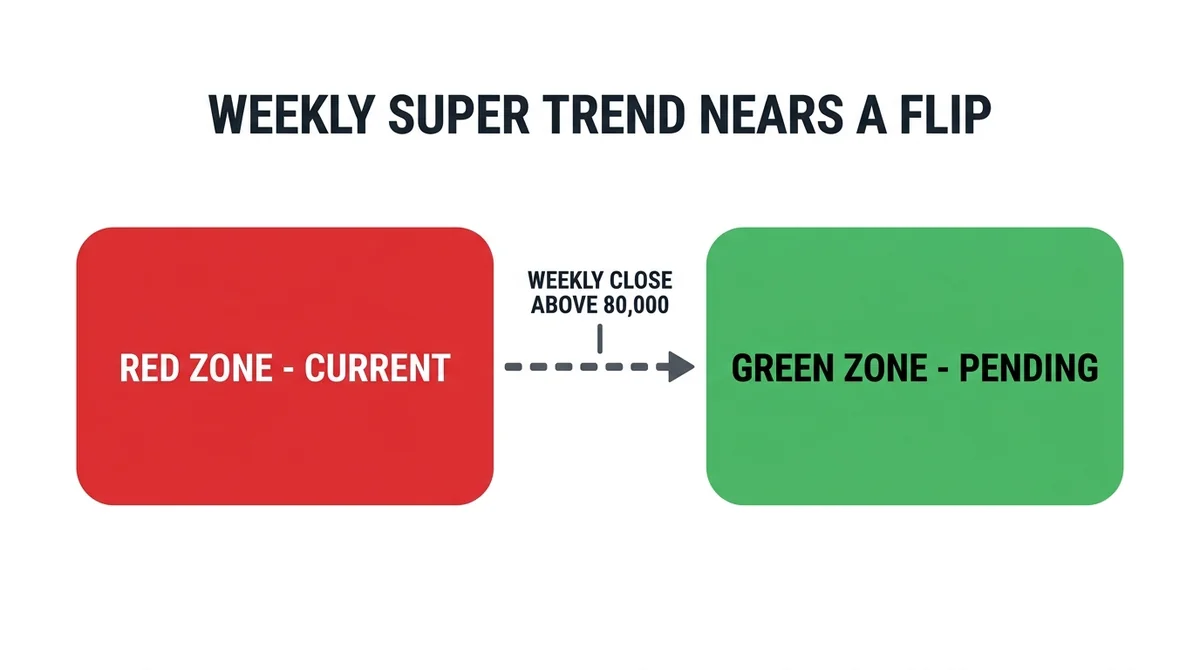
Weekly Super Trend Indicator Nears a Flip
On the weekly Bitcoin chart, the Super Trend indicator remains in the red zone but is very close to flipping green. Confirming the flip requires a weekly candle close above roughly $80,000. At the time of recording, price was already near that level and briefly broke above it within the past day or two, but no weekly close confirmation has formed yet. If confirmed, it would be the indicator's first green flip since the previous bull market.
Weekly Bullish Divergence Still in Play
Over the past few months, the large-scale bullish divergence on the weekly Bitcoin chart has continued to play out. The last similar pattern appeared after the 2022 bear market ended, followed by a bullish recovery that lasted months to years. It is important to note that this is a medium- to long-term signal, not a short-term one. Periodic pullbacks can still occur within an overall bullish recovery.
$80,000 to $82,000 Is Key Resistance
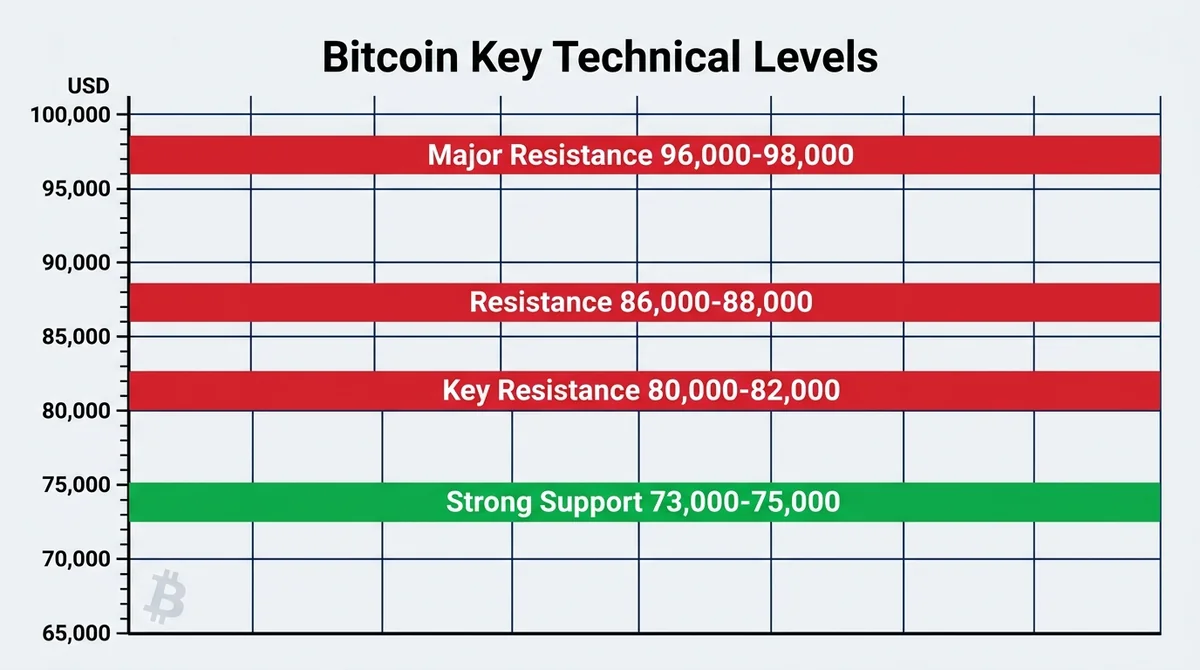
On the 3-day Bitcoin chart, price is still meeting resistance in the $80,000 to $82,000 range. After probing this area over the past day or two, price showed short-term pullback and struggle, as expected. If price ultimately confirms a breakout above $82,000 and holds, the next major target or resistance above lies at $86,000 to $88,000, followed by $96,000 to $98,000.
On the downside, if a deeper pullback occurs, the $73,000 to $75,000 range is expected to offer strong support.
Daily RSI Still Overbought, Short-Term Cooling May Continue
The daily Bitcoin RSI remains clearly overbought. Even after several days of cooling, the indicator is still elevated, meaning there is room for further repair. The short term is more likely to bring slowing upside momentum, a mild pullback, or range-bound consolidation rather than a sharp drop. Sideways action or a small pullback would help reset indicators such as the RSI to more neutral levels, opening room for further upside.
4-Hour Bearish Divergence Confirmed
On the 4-hour Bitcoin chart, price formed a higher high while the 4-hour RSI formed a lower high, confirming a bearish divergence. This signal applies only to the 4-hour timeframe, with an impact period that may last from a few days to about a week, typically showing up as weakening upside momentum, a mild pullback, or range-bound consolidation rather than a deep decline.
Liquidity Clusters Below Are Worth Watching
Price action over the past week shows multiple liquidity pools accumulated below Bitcoin: around $76,500 to $76,600, $75,000, and just above $74,000. The earlier liquidity around $80,000 has already been swept by the move higher, and there is also a small amount of liquidity near $81,500. The closest and most short-term relevant level is around $76,600, which could serve as a high-probability short-term target. Price tends to gravitate toward liquidity clusters to clear positions in those areas, so a pullback below $77,000 and a return to the $76,000 region would not be surprising.
It is worth emphasizing that the short-term pullbacks described above are barely visible on the 3-day or weekly charts. Short-term and medium- to long-term perspectives should be treated separately.
Bitcoin Dominance Firm in the Short Term
On the 3-day Bitcoin dominance chart, dominance has broken above its prior high and formed a higher low, with the short-term trend turning slightly stronger. Dominance currently sits around 60.2% to 60.3%, with notable resistance at 60.5% to 61%, where short-term struggle or a mild pullback may occur. Rising dominance means Bitcoin is gaining market share relative to the rest of the crypto market, i.e., Bitcoin is outperforming some major altcoins.
Ethereum Confirms Breakout Above $2,400
On the 3-day Ethereum chart, two consecutive 3-day candles have closed above the $2,400 resistance zone, technically beginning to confirm a breakout. However, price is still struggling near the wick highs of prior candles, and $2,460 to $2,470 may act as short-term resistance. If the breakout is valid and the $2,400 support holds, the next major target or resistance lies at $2,750 to $2,800, an area formed by prior lows and prior highs. In the short term, Ethereum and most major altcoins may see similar cooling alongside Bitcoin.
XRP Meets Resistance at $1.60 to $1.70
On the weekly XRP chart, XRP has run into Fibonacci resistance at $1.60 to $1.70, with support expected at $1.30 to $1.40 below. On the daily chart, XRP has begun a mild pullback, in line with earlier expectations of cooling after overbought conditions. The extremely overbought daily RSI, combined with short-term warning signals such as Bitcoin's 4-hour bearish divergence, is driving the short-term cooling, which may spread to other altcoins. Overall, the medium- to long-term bias remains bullish, but a short-term pullback or consolidation could last from a few days to a week.
Solana Stalls at $95 to $105
On the 3-day Solana chart, the large-scale bullish divergence remains valid, and the overall structure shows higher lows and higher highs, with a bullish trend. However, price is still struggling in the $95 to $105 resistance zone, with daily resistance at $95 to $99; the latest daily candle closed right around $99, and a breakout has not been confirmed. The daily RSI is also overbought, and combined with short-term cooling in Bitcoin and other major coins, Solana may consolidate or pull back slightly in the near term to repair indicators and prepare for further upside.
Chainlink Faces Resistance at $11.80 to $12.30
On the 3-day Chainlink chart, the overall trend has been bullish since the bullish divergence was confirmed in mid-to-late June, and it has persisted for several months. Recently, the 3-day RSI entered overbought territory while price met resistance around $11.80 to $12.30. A mild pullback or range-bound consolidation may occur in the short term to digest prior gains, after which upward momentum could rebuild in one to two weeks.
Summary
Overall, Bitcoin and major altcoins remain bullish in their medium- to long-term structure, but the short term has entered a cooling phase due to overbought conditions, resistance, and bearish divergences. This may show up as a mild pullback or range-bound consolidation lasting from a few days to about a week. Investors should distinguish between signals across different timeframes and watch the key levels outlined above.
This article is a technical information summary only and does not constitute investment advice. Crypto asset prices are highly volatile; please assess risks yourself before trading.
This article is produced by the MSXGO editorial team, AI-assisted, and reviewed through an editorial process. Fee rates and figures are subject to each platform's latest official announcements.
Finished reading? Ready to try trading?
Tokenized stocks/ETFs, crypto spot, and perpetual futures in one account — perp maker 0.02% / taker 0.045%, RWA spot buy 0.3% / sell 0.
Free sign-up · 3 quick steps