Ethereum Technical Analysis: Key Support and Resistance Levels Explained
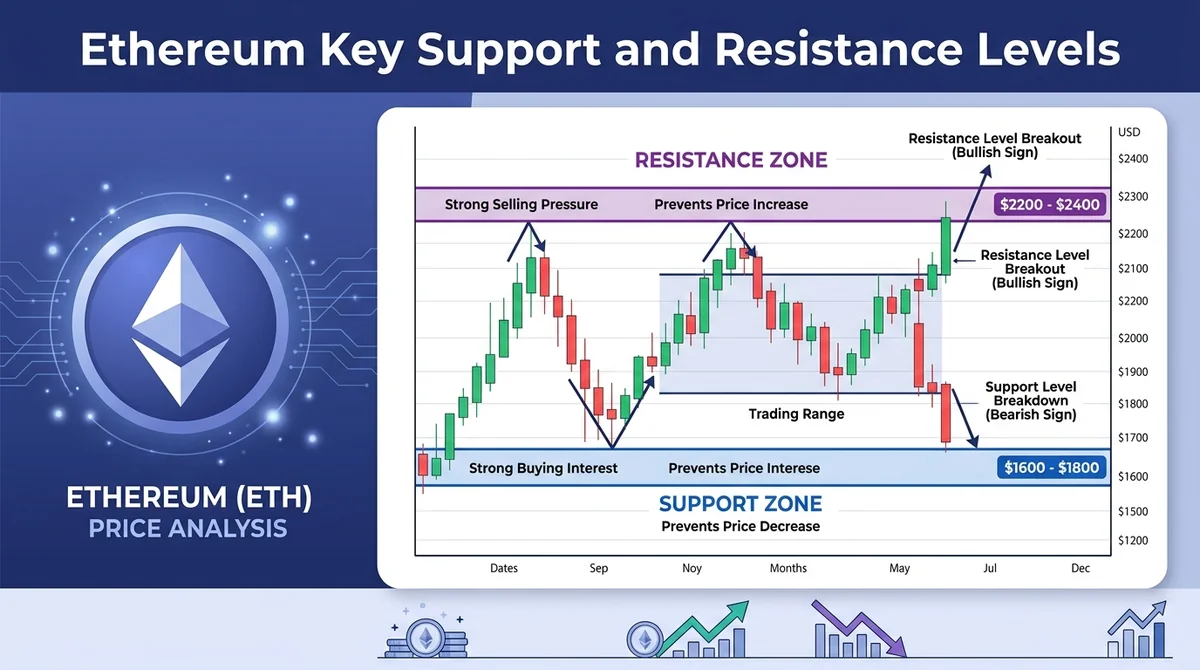
Ethereum is currently in a critical range with clear resistance above and support below. This article analyzes bullish and bearish scenarios and key levels to watch.
Article Citation Summary
Ethereum is currently in a critical range with clear resistance above and support below. This article analyzes bullish and bearish scenarios and key levels to watch.
Ethereum's recent price action shows critical technical structures across multiple timeframes. Based on daily and hourly charts, this article outlines the key support and resistance zones currently in focus, along with potential paths under different scenarios.
Daily Timeframe Scenario Analysis
On the daily chart, Ethereum's rebound from the June low is still ongoing, but market opinions diverge on the next direction. Three structural scenarios are currently being tracked:
- White Wave B Rebound (Neutral-Bearish): Price may be in Wave B of an ABC corrective structure, with the current upside being only a corrective bounce. If a first proper pullback occurs, the key support zone to watch is $1,688 to $2,074. This zone will determine whether the market continues higher (even as a larger corrective rebound) or makes new lows.
- Blue Diagonal Pattern (Bullish): Price may be in Wave C of a diagonal structure (rather than the C subwave of Wave A in the white scenario). If the next pullback is shallow and price makes new highs, the upside will show five-wave impulsive characteristics, likely followed by a Wave 2 correction before the uptrend resumes.
- Orange Wave 2 Rebound (More Bearish): The decline from the 2025 all-time high to this year's June low could be Wave 1, with the current rebound being Wave 2. This scenario differs little from the white scenario in the short-to-medium term, but is more bearish long-term.
Key Resistance and Support Zones

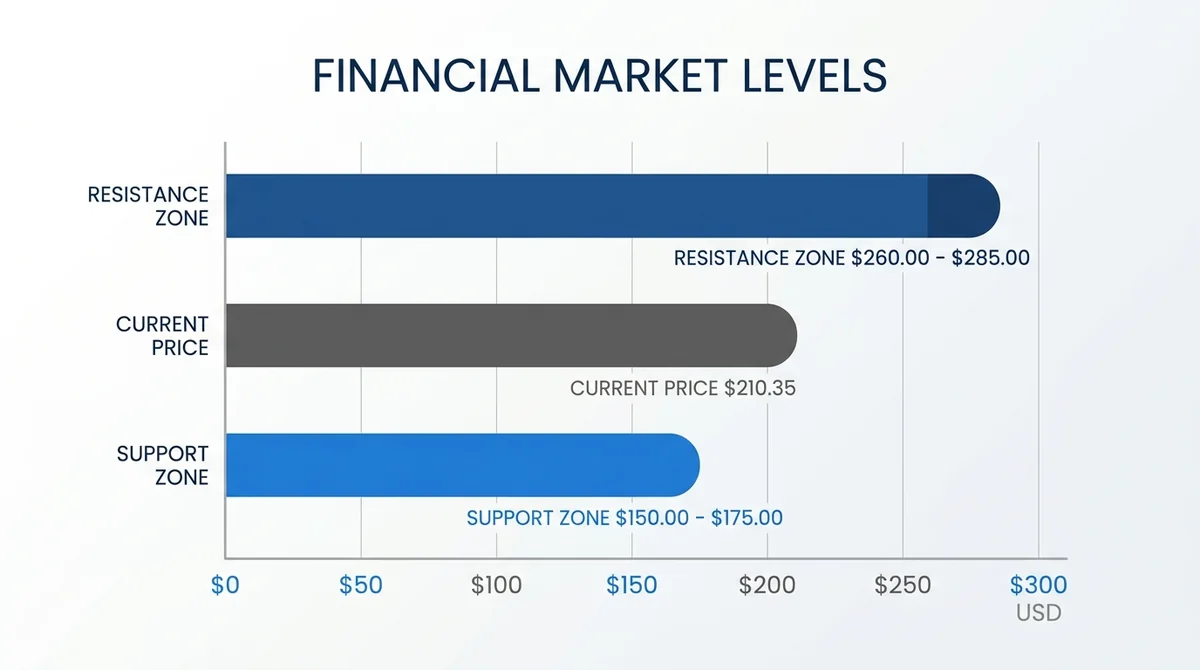
On the daily timeframe, Ethereum is currently consolidating near the April high of $2,460. The resistance zone above lies between $2,751 and $4,355, which was unlocked after the April high was broken. The key support zone below is $1,688 to $2,074, but since price has not yet pulled back, this support is not the immediate focus.
Hourly Microstructure
Switching to the 1-hour chart, the market remains range-bound. Since Sunday, price has bounced from a support zone toward resistance, but resistance has not yet been broken. The microstructure is unclear, with two possibilities:
- Orange Direct Bullish Scenario: If the current upside is a diagonal structure, price may be in Wave B of a three-wave move. The invalidation point for this scenario is $2,390, with the nearest weak support zone at $2,420 to $2,460.
- Wider Wave 4: Since resistance has not been broken, the upside may only be Wave B, and a wider Wave 4 pullback remains possible.
Key Levels to Watch
- Major Support Zone: $2,178 is the lower boundary of the major support. A break below this level would signal that the larger upside momentum is starting to break down and the reversal attempt has failed.
- Micro Support Zone: $2,420 to $2,460 is a weak support, only meaningful for short-term structure.
- Upper Resistance: The $2,550 to $2,525 zone, which must be broken to open up room toward $2,750.
Summary
Ethereum is currently in a critical range, with short-term direction depending on whether it breaks above resistance or below major support. Traders should distinguish between micro support and major support, as the major support zone is crucial for the overall uptrend. Until price breaks key levels, the market may continue to range.
This article is produced by the MSXGO editorial team, AI-assisted, and reviewed through an editorial process. Fee rates and figures are subject to each platform's latest official announcements.
Finished reading? Ready to try trading?
Tokenized stocks/ETFs, crypto spot, and perpetual futures in one account — perp maker 0.02% / taker 0.045%, RWA spot buy 0.3% / sell 0.
Free sign-up · 3 quick steps